eiDashboard v.19R1
eiDashboard Tour
This documentation is meant to provide a brief overview of each page in the eiDashboard and some of the features provided.
EIP Instances Tab (Enterprise Mode only)
When using Enterprise Mode, the EIP Instances page is the first page users see after logging in. This displays some basic information on each of the eiPlatforms that this dashboard has been configured to connect to. By selecting one of the entries from the table, that eiPlatform will become the active instance for the other management screens.
 Dashboard Tab
This is the main overview page in the eiDashboard and provides a quick glance of the active eiPlatform instance. Details on disk usage, interface health, throughput and error statistics are all available here and can be viewed on hour, day, week or all-time intervals. Additionally, each widget itself is configurable and can be moved or hidden to provide a customized experience. The green ‘Interface Health’ widget will turn red if any route is in violation of the health rules configured, making it easy to check on an eiPlatform’s overall status.

Interface Settings Tab
The Interface Settings tab displays interface and route settings and allows for the management of these components. Selecting a stage, interface, processor, etc. in the tree on the left will show all available configuration actions in the right panel. Export functionality for components can also be done from this screen, as well as starting or stopping individual listeners and routes on-the-fly. Selecting the ‘Actions’ drop-down in the right panel will display a list of available configuration options depending on the component selected.

Interface Status Tab
The Interface Status screen shows an overview of the Transactions running through the active eiPlatform, including information on total transactions, errors and average throughput statistics. Health rules can also be viewed and edited from here by selecting the ‘Health Rules’ box in the row for a given route. If using Transaction Logging Mode, selecting a route or Listener from the table will display the most recent transactions processed in a lower panel.

Runtime Tab
The Runtime tab shows the page where JVM statistics are available, including thread/memory usage, thread pool configurations and other information. Some additional features are also here – including the ability to purge the transaction logging database, reload all routes or restart the eiPlatform entirely.

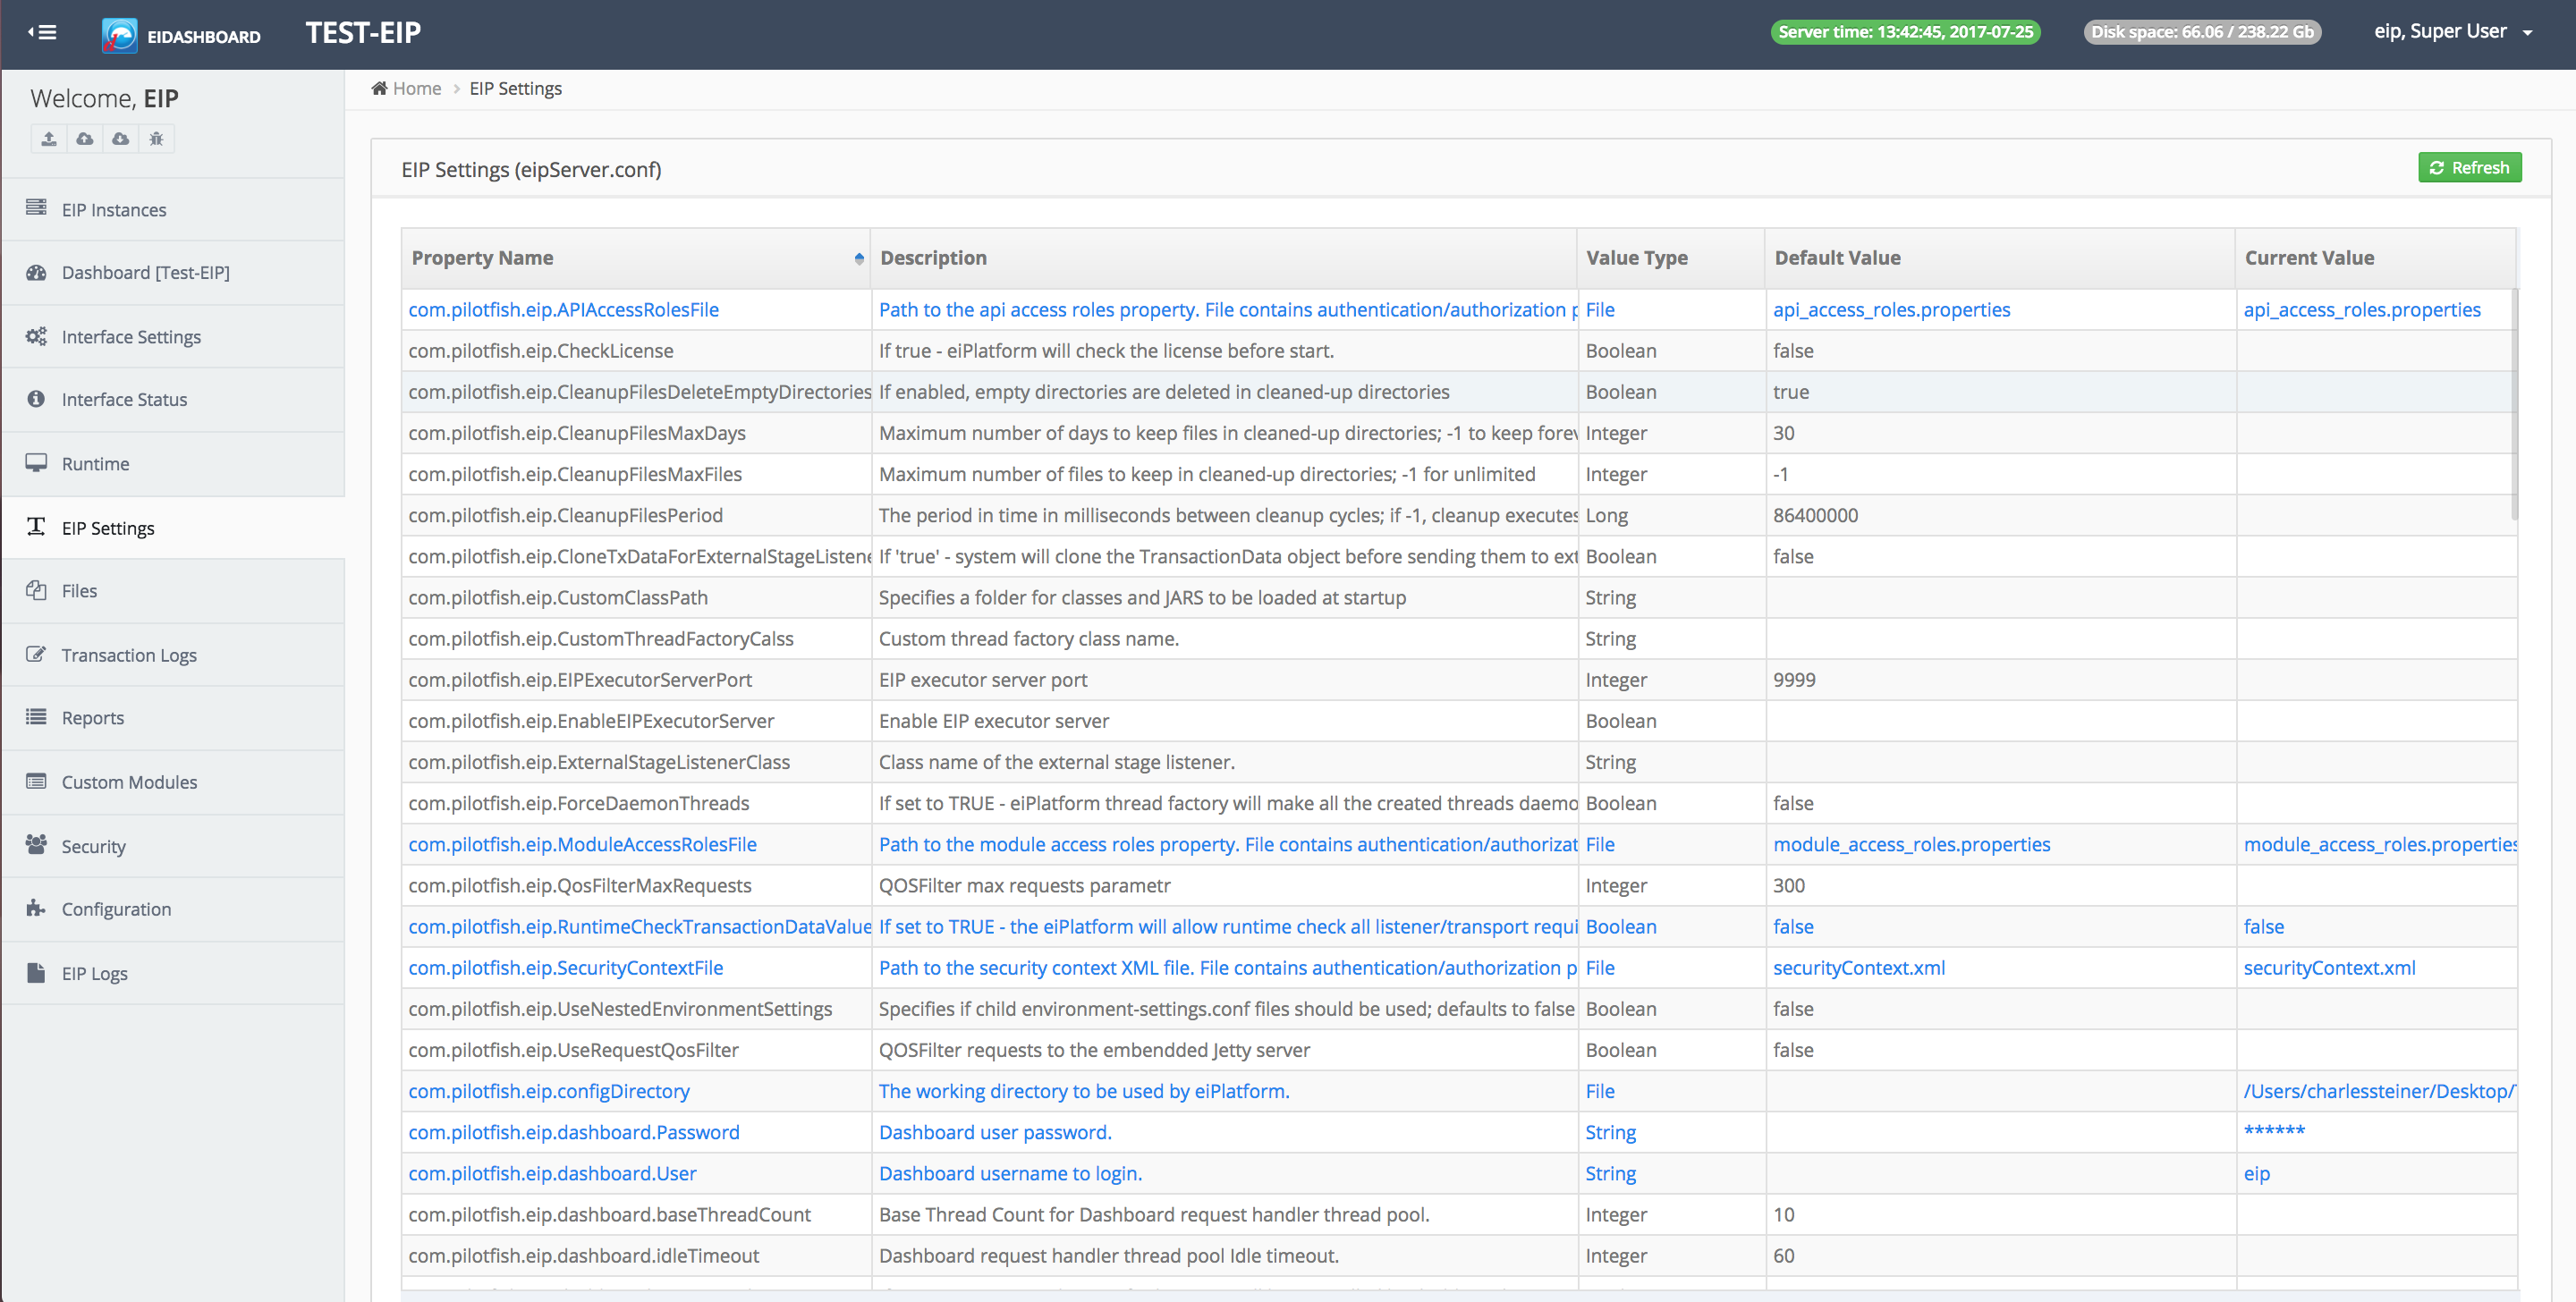
EIP Settings Tab
This page allows users to view and edit settings from the active eiPlatform’s eipServer.conf file. Note: In order for changes made here to take effect, the eiPlatform will have to be restarted.
Files Tab
The eiDashboard also offers full file editing capabilities via the Files tab. Other file operations are also here – including the ability to download locally and create new files. Selecting a file in the tree will make it available for editing in the panel on the right. The Files tab is a great place to make minor tweaks to an input file that is already deployed or move files from one directory to another. The screenshot below shows a route.xml file ready for editing.

Transaction Logs Tab (Transaction Logging Mode)
The Transaction Logs page is the heart of Transaction Logging Mode. Extensive filters can be applied to sift through an eiPlatform’s transaction history by date, attribute, completion status or component name. Once the desired transaction is found, selecting the ID button will display more detailed information on each of the transaction’s Stages. More information on filtering transaction management can be found here.
Reports Tab (Transaction Logging Mode)
This page (available only when operating in Transaction Logging Mode) is used primarily for the viewing of custom-generated transaction reports. These reports are an easy way to save commonly used transaction log filters, like ‘All transaction errors in the last day’ and re-running them whenever desired. Selecting a report will display a table of the appropriate transaction messages and each message can then be explored further. A sample of some reports and message logs is shown below.

Custom Modules Tab
This page shows any custom modules that are currently deployed to the active eiPlatform. Users can also download copies of custom modules from this page. The screenshot below shows an example of the information provided.

Security Tab
The Security tab is center for all user and permissions related functionality on the active eiPlatform. New user creation is managed from here, as well as controlling all access groups and permissions. The various options available here are explained further in the documentation for Configuring Users and Capabilities. A sample screen from the Security page is shown below.

Configuration Tab
The Configuration tab is used for viewing and editing the various configuration options for components operating on the eiPlatform instance. Starting at the root level, users can step down into individual Interfaces, Routes, Processors, etc., and edit or reload configuration settings as needed. Component import/export is also available from the Configuration page – as well as the ability to edit route.xml and Format.xml files directly, if desired. In the next screenshot, the configuration page for a sample route is displayed, complete with a route scheme diagram.

EIP Logs Tab
The EIP Logs page is the primary means for interacting with the eip.log files of the active eiPlatform. From this page, the eiPlatform logs can be filtered by text or logging level and set to auto-refresh, if desired. The logging levels (Error, Debug, Info, etc.) can be set for the various logging components from here and either the complete log file or the filtered logs shown are available for download. The screenshot below shows an example of this page in action.
