eiConsole v.18R2
Documentation
eiConsole Inline Test Mode
You will need to download sample files to do this tutorial. If you have not done so yet, please click this LINK.
To activate Testing Mode within the eiConsole, select the interface you want to test in the main Route File Management window. Double click to open the interface.
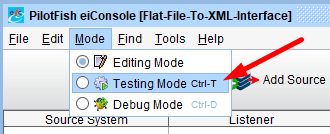
Once the Route Overview Grid for this interface opens, select the Mode Menu and choose the Testing Mode option.
When you switch to Testing Mode, all of the icons in the grid between the Source System and Target System will appear as question marks.
A question mark indicates a stage of a test that you have not yet chosen to run.
When you select a stage in the Main Route Grid, the corresponding Objects within selected stage panel appear.
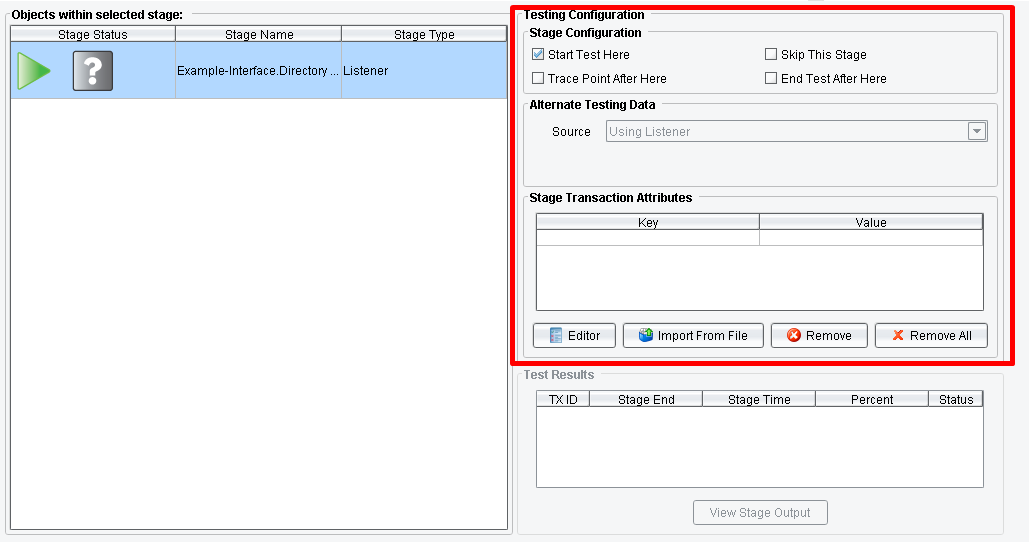
At each stage within the route there is a corresponding Testing Configuration in the lower right hand corner of the screen.
The Stage Configuration area will allow you to start the test at a particular location, skip a particular stage, insert a Trace Point – which means that a transaction processing will stop and give the user an opportunity to edit the data before passing it further along through the system and end a test at a given point.
To configure the starting stage of a test, select the stage where you wish to start the test and click the Start Test Here checkbox. In case we don’t use the Listener stage, we should configure an alternate source of data. Select the From File.
To skip a particular stage, select the stage from the Main Route Grid, then select the desired sub-stage within the Objects within selected stage area. Here we have selected Forking and checked the Skip This Stage box.
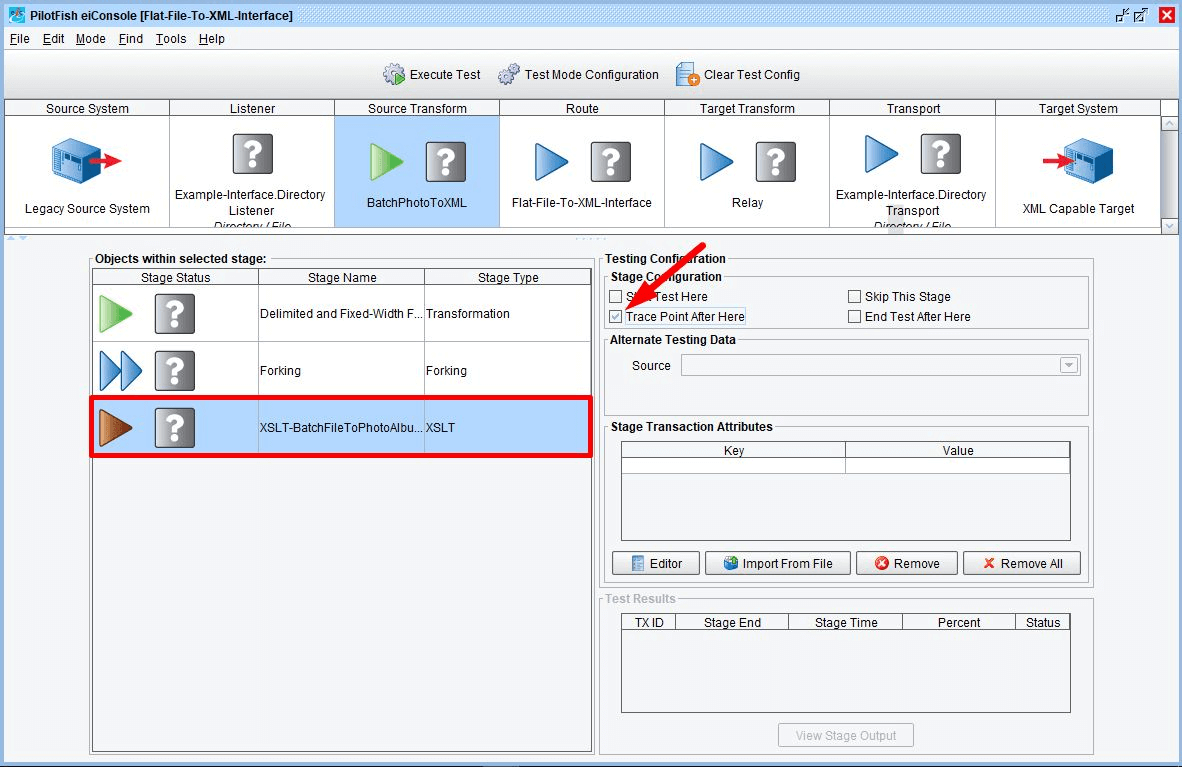
To insert a trace point after a particular stage, select the stage requiring the trace and check the Trace Point After Here box.
To end the test after a particular stage, select the desired stage, (here we selected Target Transform) and check the End Test After Here box. Once the test has been configured, the question marks will be accompanied by green arrows, blue arrows and red squares.
• A green arrow indicates the starting stage of a particular test.
• A blue arrow indicates a stage that may be executed during the test process.
• A red square indicates a stage after which test processing will complete.
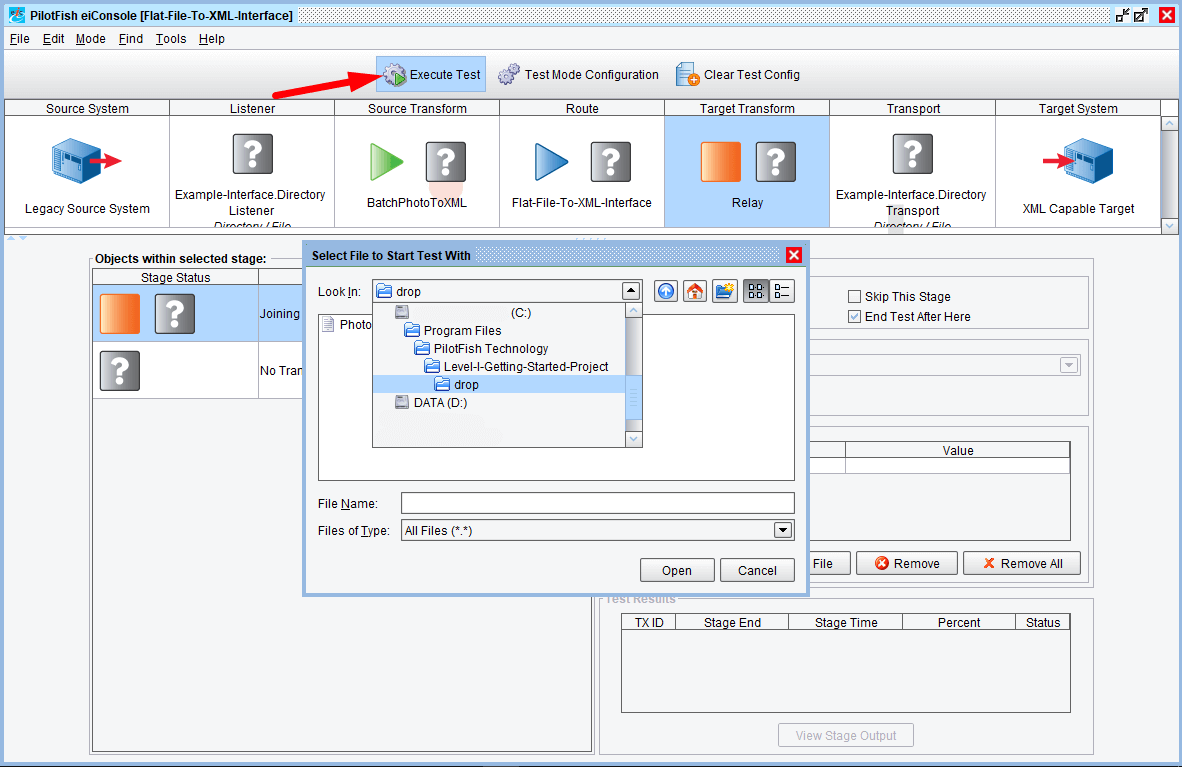
To execute a test with a configured test configuration click the Execute Test button on the upper left hand side of the screen.
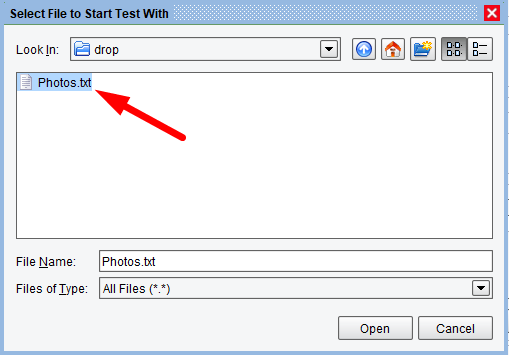
If the test was started at the Listener stage, the Listener will fire and begin to poll for information or wait for incoming requests (depending on the type of Listener). If the test was started at some point after the Listener, you should select an alternate data source: From File or From Text. Here we started the test at the Source Transform stage and configured the data source as the From File. A dialogue window appears that prompts us to Select File to Start Test With.
Our Working Directory is the Level-I-Getting-Started-Project. We select the drop folder and double click to open.
Select the file you wish to test and click Open. We selected the Tutorial’s Photos.txt file. (Generally, the file would be located in the data folder, here we show the drop folder).
Test processing will begin. As each stage completes, the question mark will be replaced by a checkmark if the stage is successful; or a red X if the stage fails.
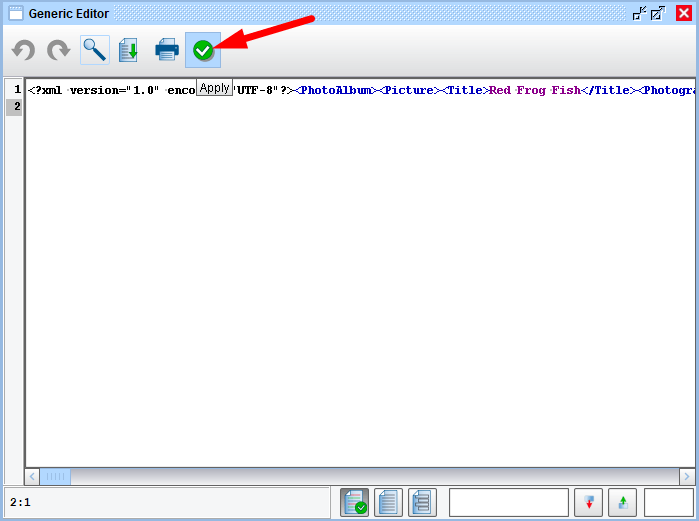
When a Trace Point is reached, the Generic Editor will be opened. This will allow you to edit the data before passing it along to the next stage. The Apply button is for introducing the changes.
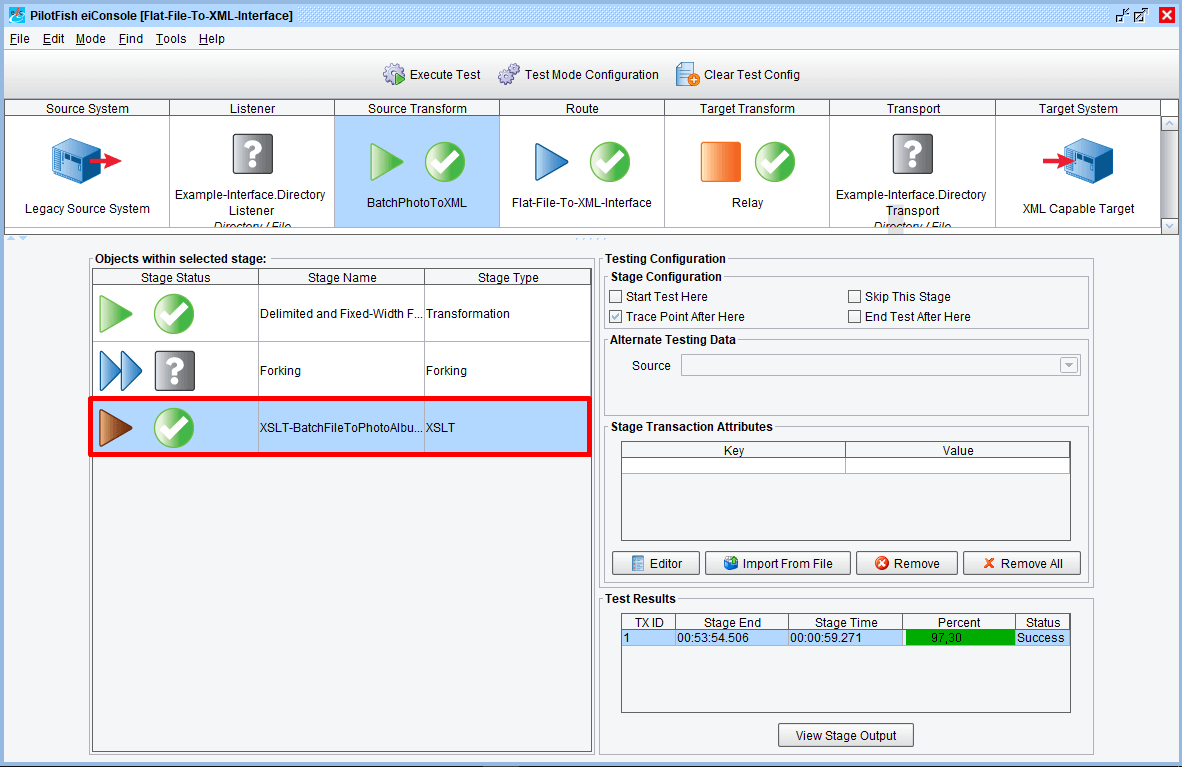
Once the test is completed, the output of each stage is viewable. Select the stage from the main Route Grid and for which you would like to view the output and then if required select a sub-stage within the Objects within selected stage section of the screen.
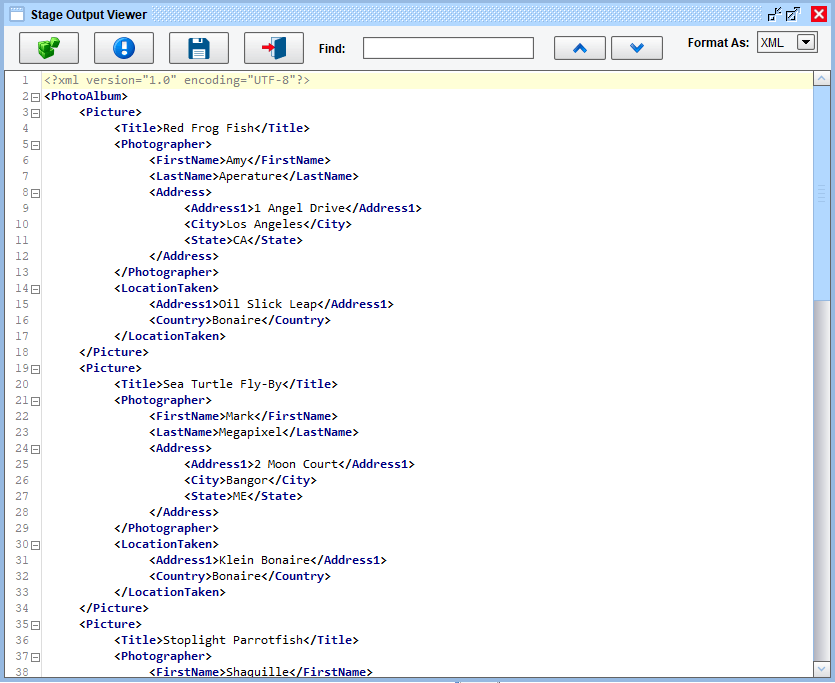
Double clicking a row in that grid will bring up the data as it appeared when processing completed at that stage
Here the XSLT stage view.
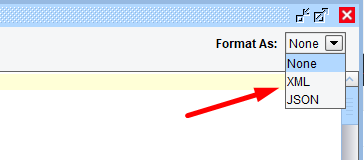
You can use the dropdown menu at the top of the Stage Output Viewer to switch between XML and JSON formats.
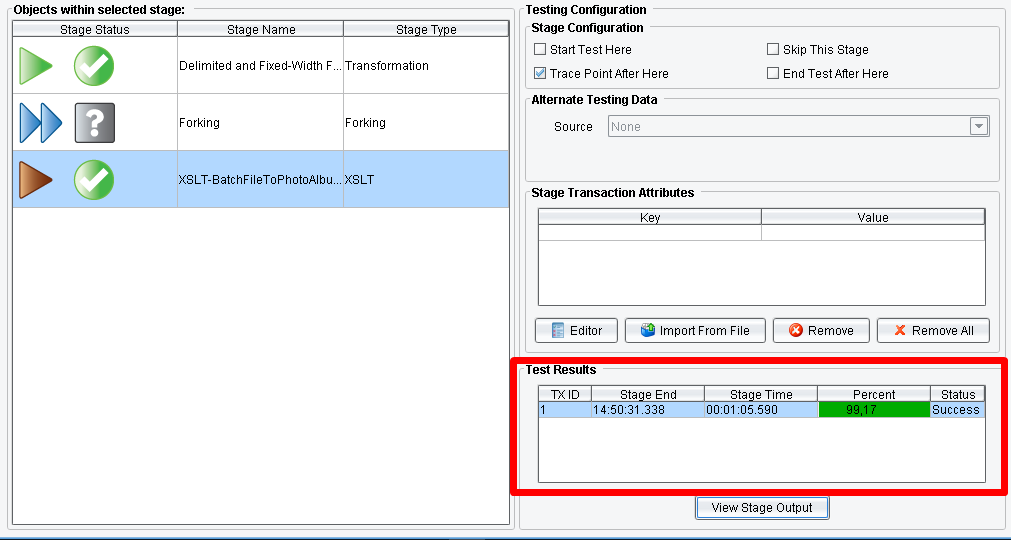
When a stage is selected the Test Results pane in the lower right hand portion of the screen will indicate the percentage of time that a particular stage took relative to other stages within the interface, the interface status and its completion time.
If an error were to occur, the green checkmarks would be replaced by red Xs. Double clicking on the stage where the error occurred would display all available error details.
To save a Test Configuration, use the Test Mode Configuration button. It allows the user to save or save as a current test configuration.
Click Save and enter Test Transformation and Mapping. Click on the Save button.
You will be shown a message about the successful saving. Click OK.
Now by clicking the Test Mode Configuration button, you get additional functionality – to open or delete the previous saved configurations.
To clear a Test Configuration, choose the Clear Test Config button. This will reset the question marks in the main route grid to their initial state.
Testing is now complete.


