Performance & Optimization – New Threading Model
New Threading Model (NTM) is a new approach in dealing with transactions in eiPlatform. In the original model, we have a single thread pool for one transaction. In the NTM we can use any number of thread pools configured for any number of stages. By default, we have one thread pool by one stage. There, thread pools are very configurable which allows tuning the eiP very accurately.
The NTM is implemented as a separate module. It allows us to switch the eiP to use the old model, just set the parameter ‘com.pilotfish.eip.useNewThreadModel’ to false.
Configuration
One can use NTM without providing any additional configuration of the thread pools. All that is necessary for it is to have ‘com.pilotfish.eip.useNewThreadModel’ property set to true.
In that case, the system works with default values of the settings from ‘eipServer.conf’ file. See ‘Default configuration’ section for more details.
To configure NTM explicitly one needs to create a ‘pools.xml‘ file next to the ‘route.xml‘ file in the appropriate Route folder. See the next sections for more details.
Each thread pool has several parameters to set:
1) Base Thread Count – the number of threads to keep in the pool, even if they are idle.
2) Max Thread Count – the maximum number of threads to allow in the pool.
3) Idle Timeout – when the number of threads is greater than the core, this is the maximum time that excess idle threads will wait for new tasks before terminating.
4) Queue Size – the size of the queue to use for holding tasks before they are executed. If the queue size is set to unbounded, the system uses LinkedBlockingQueue. Otherwise – ArrayBlockingQueue with queue size as a constructor parameter.
5) Expiration Timeout. If the thread in the pool takes more time than defined by this parameter – the system pushes it out of the pool and terminates.
Default configuration
When NTM is not configured explicitly, it uses configuration settings from ‘eipServer.conf’ file.
To configure the default behavior of the NTM you may need to define the following properties:
1) ‘com.pilotfish.eip.ntm.stage.baseThreadCount’ – Base Thread Count
2) ‘com.pilotfish.eip.ntm.stage.maxThreadCount’ – Max Thread Count
3) ‘com.pilotfish.eip.ntm.stage.idleTimeout’ – Idle Timeout
4) ‘com.pilotfish.eip.ntm.stage.stageQueueSize’ – Queue Size
5) ‘com.pilotfish.eip.ntm.stage.expirationTimeout’ – Expiration Timeout
There’s one more very important property – ‘com.pilotfish.eip.ntm.PoolPerRoute’. If this property set to ‘true’, the system initializes one thread pool for one route, not stage. In this case default thread pools options are used, such as:
‘com.pilotfish.eip.transact.baseThreadCount’,
‘com.pilotfish.eip.transact.maxThreadCount’,
‘com.pilotfish.eip.transact.queueSize’,
‘com.pilotfish.eip.transact.idleTimeout’,
and ‘com.pilotfish.eip.ntm.stage.expirationTimeout’.
Thread Pools Configuration
As was mentioned before, one can configure thread pools using ‘pools.xml’ file in the appropriate ‘route’ folder. The root element of this file is ‘PoolsConfig’ element.
So far, three different child elements are acceptable:
1) ‘Pool’
2) ‘MinimumListenerVolume’
3) ‘SaveTransactionsBeforeStageExecution’
In this chapter, we are interested in the first one. Each ‘Pool’ element defines a separated thread pool and its parameters. It has 6 mandatory attributes (letter case is not important):
1) ‘name’ – the name of the certain thread pool. Try to use obvious names in order to be able to find necessary log lines easily.
2) ‘BaseThreadCount’ – base thread count of the thread pool.
3) ‘MaxThreadCount’ – max thread count of the thread pool.
4) ‘IdleTimeout’ – idle timeout of the thread pool (in milliseconds).
5) ‘QueueSize’ – the size of the queue for this thread pool.
6) ‘ExpirationTimeout’ – expiration timeout of the tasks executed in this thread pool (in milliseconds).
Only one type of child is allowed for ‘Pool’ element. It is ‘Stage’ element. Each stage element defines a certain stage or set of stages that will use this thread pool. ‘Stage’ element has two attributes:
1) ‘type’ – the type of the stage. This is a mandatory attribute and it has a set of allowed values:
? – “Listener”
? – “Transport”
? – “XSLT”
? – “Transformation”
? – “Processor”
? – “Routing”
? – “Infrastructure”
? – “Forking”
? – “Joining”
? – “Any” – any not explicitly configured stage will use one common thread pool. Only “Any” or “Every” is acceptable, not both.
? – “Every” – any, not explicitly configured stage will use its own thread pool.
2) ‘name’ – name of the stage. E.g. ‘test1.Directory Listener’. This field might be empty or missing all together depending on the ‘type’ attribute.
‘Stage’ element can’t contain any children.
To show you how it works, sample pools.xml is provided below:
<PoolsConfig>
<Pool name="MainTransportPool" BaseThreadCount="4" MaxThreadCount="10" IdleTimeout="500" ExpirationTimeout="10000" QueueSize="10">
<Stage type="Transport" name="test1.Directory Transport"/>
</Pool>
<Pool name="Pool_Others" BaseThreadCount="4" MaxThreadCount="10" ExpirationTimeout="10000" IdleTimeout="500" QueueSize="10">
<Stage type="Every"/>
</Pool>
</PoolsConfig>
This configuration XML defines three thread pools:
1) ‘MainTransportPool’ – as we can see in the XML, this thread pool will work with only one stage – ‘test1.Directory Transport’. Such an approach is necessary when we need to tune the thread pool configuration for some specific stage or stages.
2) ‘Pool_Others’ – this thread pool is necessary to service all other stages. Considering that we chose ‘Every’ stage type, every not explicitly configured stage will use its own thread pool.
It is possible not to configure the thread pool for other stages. In this case, the system will create one pool per stage with default thread pool parameters.
Listeners’ volume configuration
There’s a possibility to control listener volumes. One can specify how many transactions should be transferred through a specific listener in a given period of time (or during some period). If the listener doesn’t process the expected amount, the system decides that it is hung/deadlocked and restarts the listener.
One should be very careful in configuring this feature. The incorrect configuration may cause unnecessary listener restarts.
To configure the listener’s volume checker you need to open the appropriate route’s ‘pools.xml’ file and add ‘MinimumListenerVolume’ element(s) as a child of ‘PoolsConfig’ element. This element should contain two mandatory attributes:
1) ‘ListenerName’ – the name of the listener to control.
2) ‘CronCleanupAt’ – cron expression that defines the time when the system should clean-up transaction statistics. For more details see https://docs.oracle.com/cd/E12058_01/doc/doc.1014/e12030/cron_expressions.htm
‘MinimumListenerVolume’ element should contain one or more ‘DurationVolume’ element. Each of such elements configures one specific checking rule. Depending on rule type, this element might have two different attribute sets:
1) Time scheduled rule. This type controls the listener’s volume for a defined period of time. For this type one should define three attributes:
1. ‘Start’ – start time of the control period. Format is “hh:mm”, e.g. “18:50”.
2. ‘End’ – end time of the control period. Format is “hh:mm”, e.g. “18:56”.
3. ‘TransactionsCount’ – count of the transactions that should be processed through this listener during a defined period of time. If the listener processes less than the defined number of transactions during this period of time – the system restarts it.
2) Duration rule. This type controls the listener’s volume for the duration of time. For this type one should define two attributes:
1. ‘DurationMS’ – duration of the checking period in milliseconds.
2. ‘TransactionsCount’ – count of the transactions that should be processed through this listener during the defined duration of time. If the listener processes less than the defined number of transactions during this duration of time – the system restarts it.
You should pay attention to the ‘CronCleanupAt’ attribute. The issue is that to control the listener’s volume, the system should collect minimal data about the processed transactions. Thus, the system needs to clean-up this information from time to time. You need to avoid clean-up time crossing with the control times.
You shouldn’t forget to configure listeners’ volume check period in ‘eipServer.conf’ file. Property ‘com.pilotfish.eip.ntm.listenerVolumeCheckTimeoutMs’ is responsible for that.
The example of the listener’s volume checker configuration is below:
<PoolsConfig>
...
<MinimumListenerVolume ListenerName="test1.Directory Listener" CronCleanupAt="0 15 10 ? * *">
<DurationVolume Start="18:32" End="19:33" TransactionsCount="200" />
<DurationVolume DurationMS="10000" TransactionsCount="5" />
</MinimumListenerVolume>
<MinimumListenerVolume ListenerName="test1.FTP Listener" CronCleanupAt="0 0 12 * * ?">
<DurationVolume Start="10:00" End="11:00" TransactionsCount="20" />
</MinimumListenerVolume>
</PoolsConfig>
In this example, we define volume checkers for two listeners. For ‘test1.Directory Listener’ we define two rules. In such a combination of rules, this listener will have to process more than 200 transactions from 18:32 till 19:33 every day and more than 5 transactions in 10 seconds. The ‘test1.FTP Listener’ will have to process 20 transactions from 10:00 till 11:00. For the first volume controller, clean-up will be performed at 15:10 every day. For the second one will fire clean-up at 12 pm (noon) every day.
Transaction saving configuration
There’s an ability to enable saving transactions before certain stage execution. This is necessary in order not to lose transaction data after any error on this stage, and have an ability to restart it. Thus, NTM removes saved transactions from the disc after successful stage execution.
NTM keeps the transaction data file in the ‘saved-transactions’ directory of the main interface folder (e.g. eip-root). The name of the file with transaction data consists of route name, stage name, stage type and transaction ID. It has an “stx” extension.
One can enable any stage to save transactions before execution. To do it, you need to edit the appropriate ‘pools.xml’ file. Add ‘SaveTransactionsBeforeStageExecution’ element as a child of the ‘PoolsConfig’ element. This element shouldn’t have any attributes but must have one or more child elements or ‘Stage’ elements, that are the same as ones described in section ‘Thread Pools Configuration’. An important thing to remember is: this stage can’t be type ‘Any’. The only allowed generic type is ‘Every’, which activates transaction saving for every stage in the route.
There could be any number of the ‘Stage’ elements, but there’s no need to define any other stage elements if there’s one “Every” stage type.
Here’s an example of the configuration:
...
<PoolsConfig>
<SaveTransactionsBeforeStageExecution>
<Stage type="Processor" name="ROOT.test.Processor"/>
<Stage type="Transport" name="ROOT.test.Transport"/>
</SaveTransactionsBeforeStageExecution>
</PoolsConfig>
This configuration will force the processor and transport to save transactions before execution.
Statistics collecting
NTM allows the collection of statistical data about transaction data processing and other technical details. There are five properties in the eiP server configuration that are responsible for statistics collecting:
1) ‘com.pilotfish.eip.ntm.heartbeat.period’ – heartbeat period in milliseconds. It defines the timeout for saving statistics data about each thread pool.
2) ‘com.pilotfish.eip.ntm.collectStatistic’ – if “true”, system collect
s statistics.
3) ‘com.pilotfish.eip.ntm.memoryCheckPeriod’ – the period in milliseconds when the system stores information about memory and threads in runtime.
4) ‘com.pilotfish.eip.ntm.dumpStatisticPeriodSeconds’ – period of time (in milliseconds) when the system saves statistical data to disk. Before that, NTM keeps statistical data in the memory.
5) ‘com.pilotfish.eip.ntm.dumpStatisticFolder’ – the folder to store statistical data.
Be careful with the statistics collector configuration. You should define a heartbeat period considering the quantity of the transactions in a certain route. E.g. there’s no sense to set a heartbeat period to 100 milliseconds if there are only a couple of transactions per minute. Also, there’s no need to set memory check period to a very small number. You can easily notice memory changing tendency if you set it to 1000 milliseconds or more. Recommended dump statistics period value depends on certain aims. If you want to decrease hard drive IO operations and you’re sure about the availability of the memory (or there are not very many statistics collected), you can set it to a larger value.
System collects the following statistical information:
1. Transaction statistic – transaction ID, start time, end time, execution status (success/failure) and error message/exception if transaction processing failed.
2. Stage statistic – for each stage and each processed transaction it contains information about its start time, end time, stage status (success/failure), error message and flag that indicates if the stage has timed out.
3. Thread pool statistic – the time of the snapshot of the thread pool state, the number of the active tasks, and the approximate total number of tasks that have ever been scheduled for execution.
4. Runtime memory statistic – the time of the memory snapshot, free memory, total memory, max memory.
5. Runtime threads statistic – thread count, peak thread count and total started thread count.
As was mentioned above, the system stores statistical information in files. These file are not readable using standard text viewing applications, because they contain serialized objects. These files have ‘eipstat’ extension. Their name consists of start and end time of the statistical data they contain. For example, here’s typical statistical dump file name: ‘102009_145534-102009_155534.eipstat’.
Statistics review tool
There’s a UI statistics review tool implemented. You can access it either via eiConsole menu (Tools -> EIP Statistics Review…) or by running ‘com.pilotfish.eip.gui.console.stat.StatisticsReview’ class. You can see how it looks below:
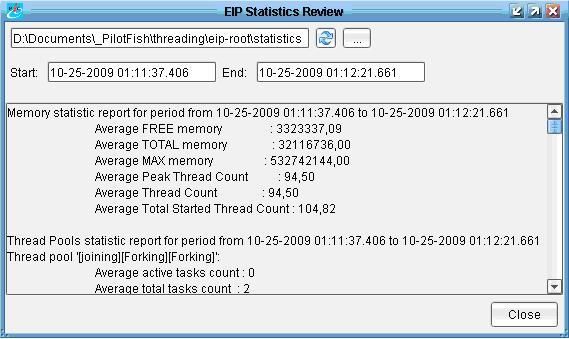
In the top of the window you can specify the folder to look for statistics files. If you start the utility from eiConsole it opens the appropriate ‘statistics’ folder automatically. In the appropriate start and end fields, you can specify start and end times to review the statistical data. In the text area below you can see statistic summary for a given period.
eipServer.conf properties index
1) ‘com.pilotfish.eip.ntm.stage.baseThreadCount’ – Base Thread Count for thread pool in pool-per-stage mode.
2) ‘com.pilotfish.eip.ntm.stage.maxThreadCount’ – Max Thread Count for thread pool in pool-per-stage mode.
3) ‘com.pilotfish.eip.ntm.stage.idleTimeout’ – Idle Timeout for thread pool in pool-per-stage mode.
4) ‘com.pilotfish.eip.ntm.stage.stageQueueSize’ – Queue Size for thread pool in pool-per-stage mode.
5) ‘com.pilotfish.eip.ntm.stage.expirationTimeout’ – Expiration Timeout for thread pool in pool-per-stage mode.
6) ‘com.pilotfish.eip.ntm.PoolPerRoute’. If this property set to ‘true’, system initializes one thread pool for one route (pool-per-route mode), not stage (stage-per-route mode).
7) ‘com.pilotfish.eip.ntm.heartbeat.period’ – There’s such a notion as ‘heartbeat’ in the NTM. It means that every X milliseconds system calls necessary listeners and allows them to handle anything in the runtime at this precise moment. So, this property defines this heartbeat period in milliseconds.
8) ‘com.pilotfish.eip.ntm.collectStatistic’ – defines if system should collect statistical data. If “true” – system collects statistics.
9) ‘com.pilotfish.eip.ntm.dumpStatisticPeriodSeconds’ – period of time (in milliseconds) when the system saves statistical data to disk. Before that, NTM keeps statistical data in the memory.
10) ‘com.pilotfish.eip.ntm.dumpStatisticFolder’ – the folder to store statistical data.
11) ‘com.pilotfish.eip.ntm.memoryCheckPeriod’ – the period in milliseconds when the system stores information about memory and threads in runtime.
12) ‘com.pilotfish.eip.ntm.allowCoreTimeout’ – If false (default) core threads stay alive even when idle. If true, core threads use keepAliveTime to time out waiting for work.
13) ‘com.pilotfish.eip.ntm.listenerVolumeCheckTimeoutMs’ – Timeout of the checking listeners’ volumes (milliseconds).
14) ‘com.pilotfish.eip.ntm.saveDataToFileOnPoolPause’. This property defines whether the system should save transaction data to file on thread pool pause. Note, that if your interface will presumably process big transactions, you should set this property to ‘true’, in order not to cause memory issues. On the other hand, if the transactions are going to be small, it’s more desirable to set it to ‘false’.