eiDashboard v.19R1
Analyzing Transaction Logs
The most powerful feature of Transaction Logging Mode is the ability to locate a transaction and gather information to whatever level of detail is desired. In this tutorial, we will locate a transaction with an error and drill down into the message details to figure out what went wrong.
Checking for Errors
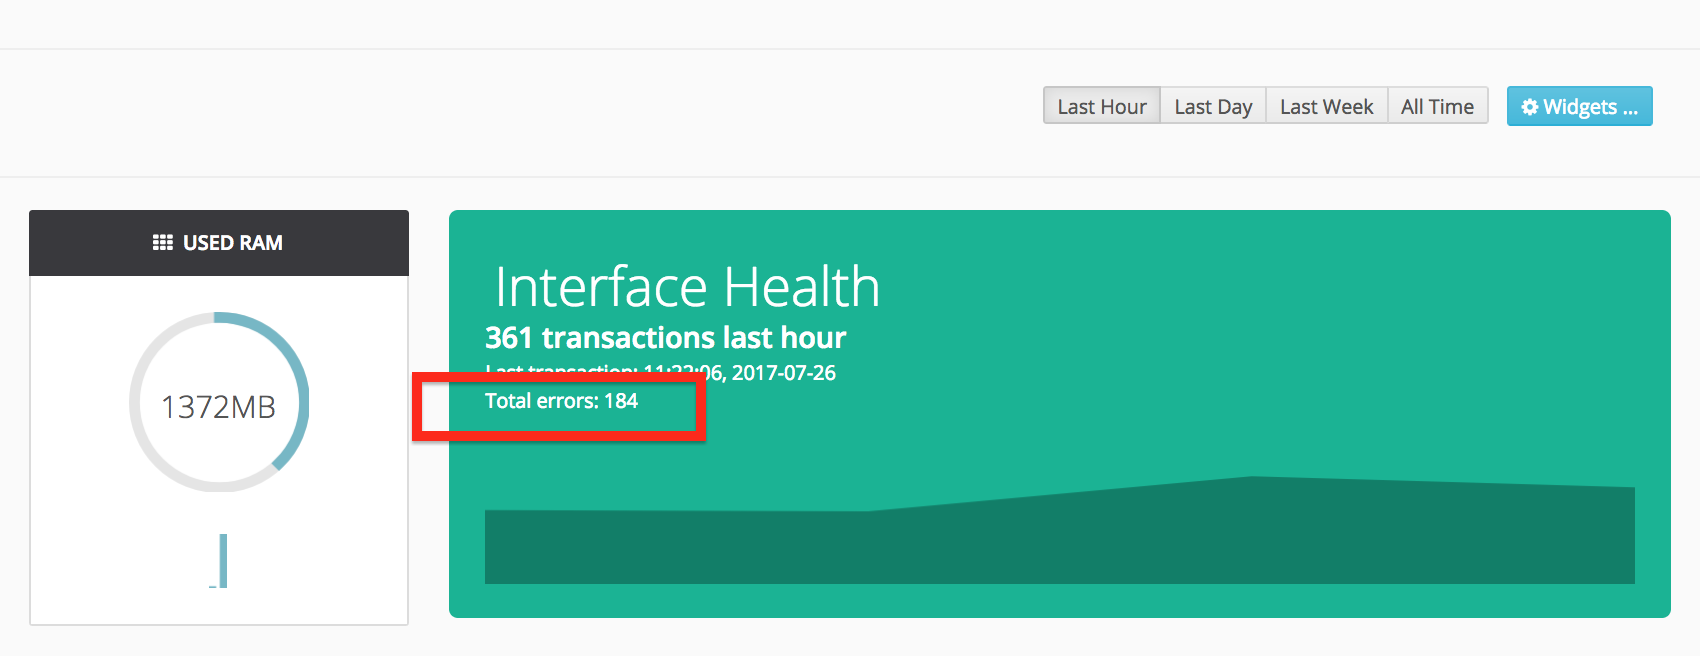
Finding Transactions with errors can be done from several places in the eiDashboard, but the easiest starting point is the Dashboard page. The ‘Interface Health’ widget displays a convenient count of errors that have occurred in the time frame specified. Additionally, if any error-related health rules are in place and violated, the entire widget will be red. Looking at the screenshot below, we clearly have some errors that need addressing.
Filtering Transaction Logs
The ‘Transaction Logs’ page is the starting point for searching and filtering transactions. Using the available filters, we can quickly search for transactions by date, completion and component name. Since we are only concerned with errors, select ‘No’ in the ‘Include completed’ option and hit ‘Apply’. The message logs table below will refresh to show our new selection.
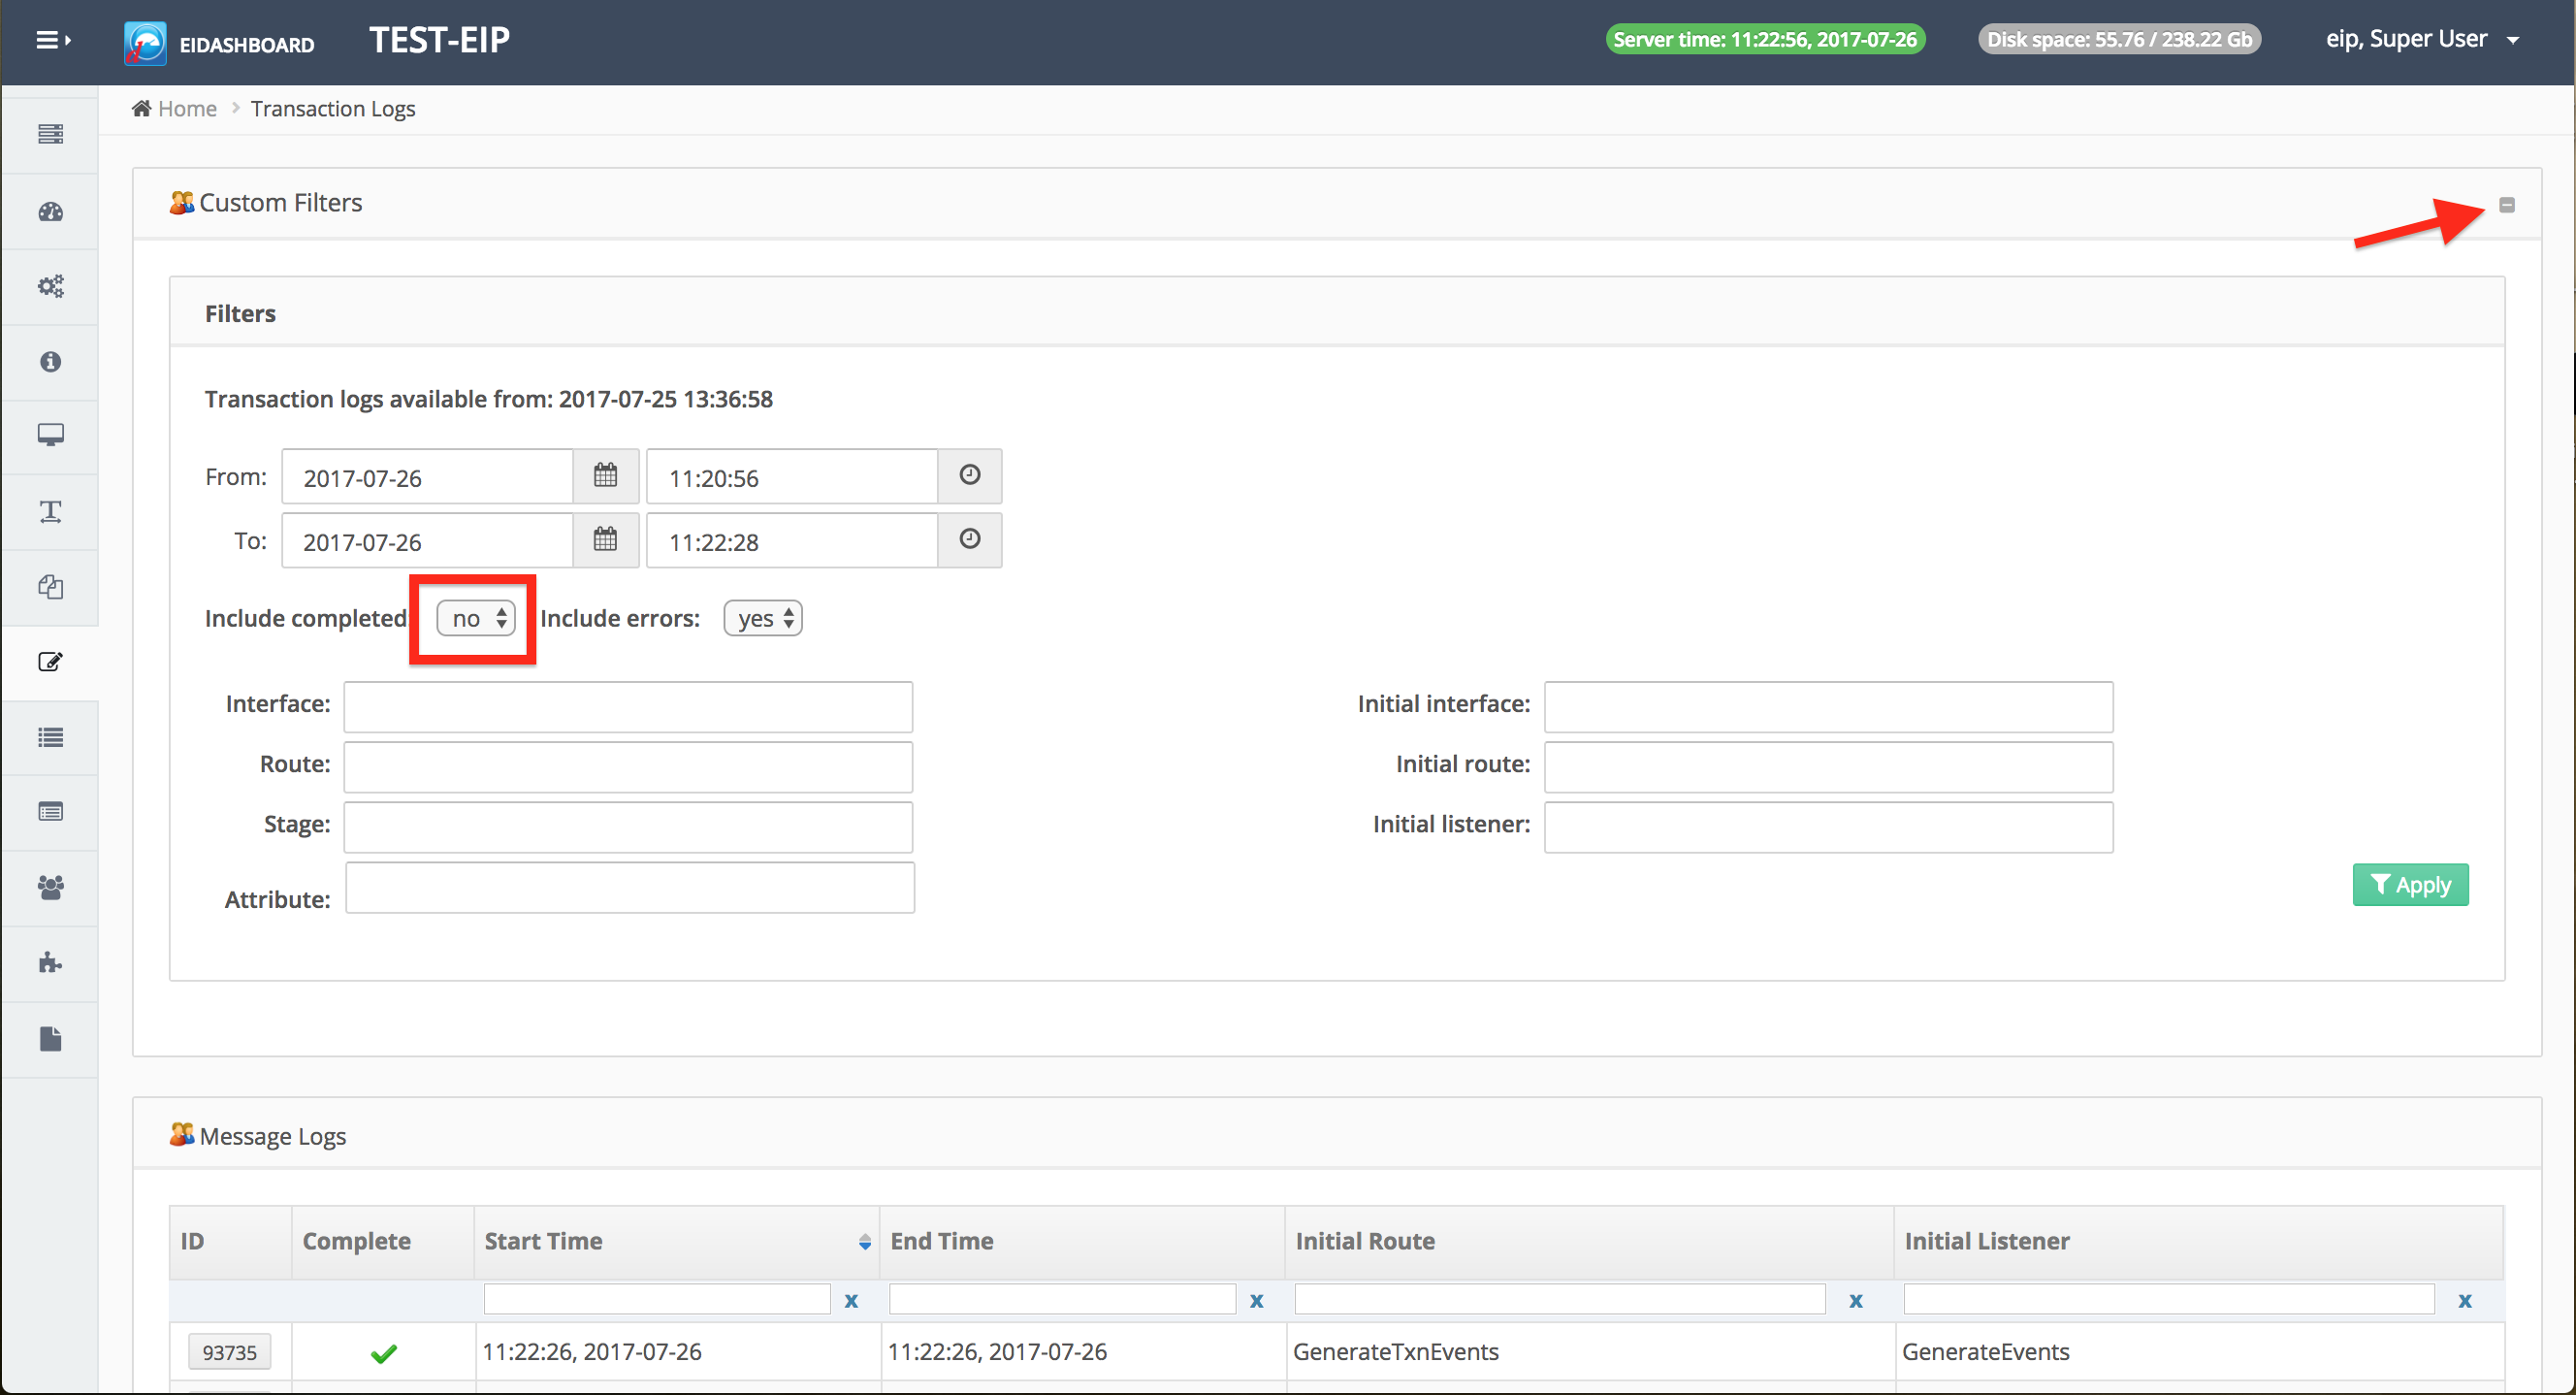
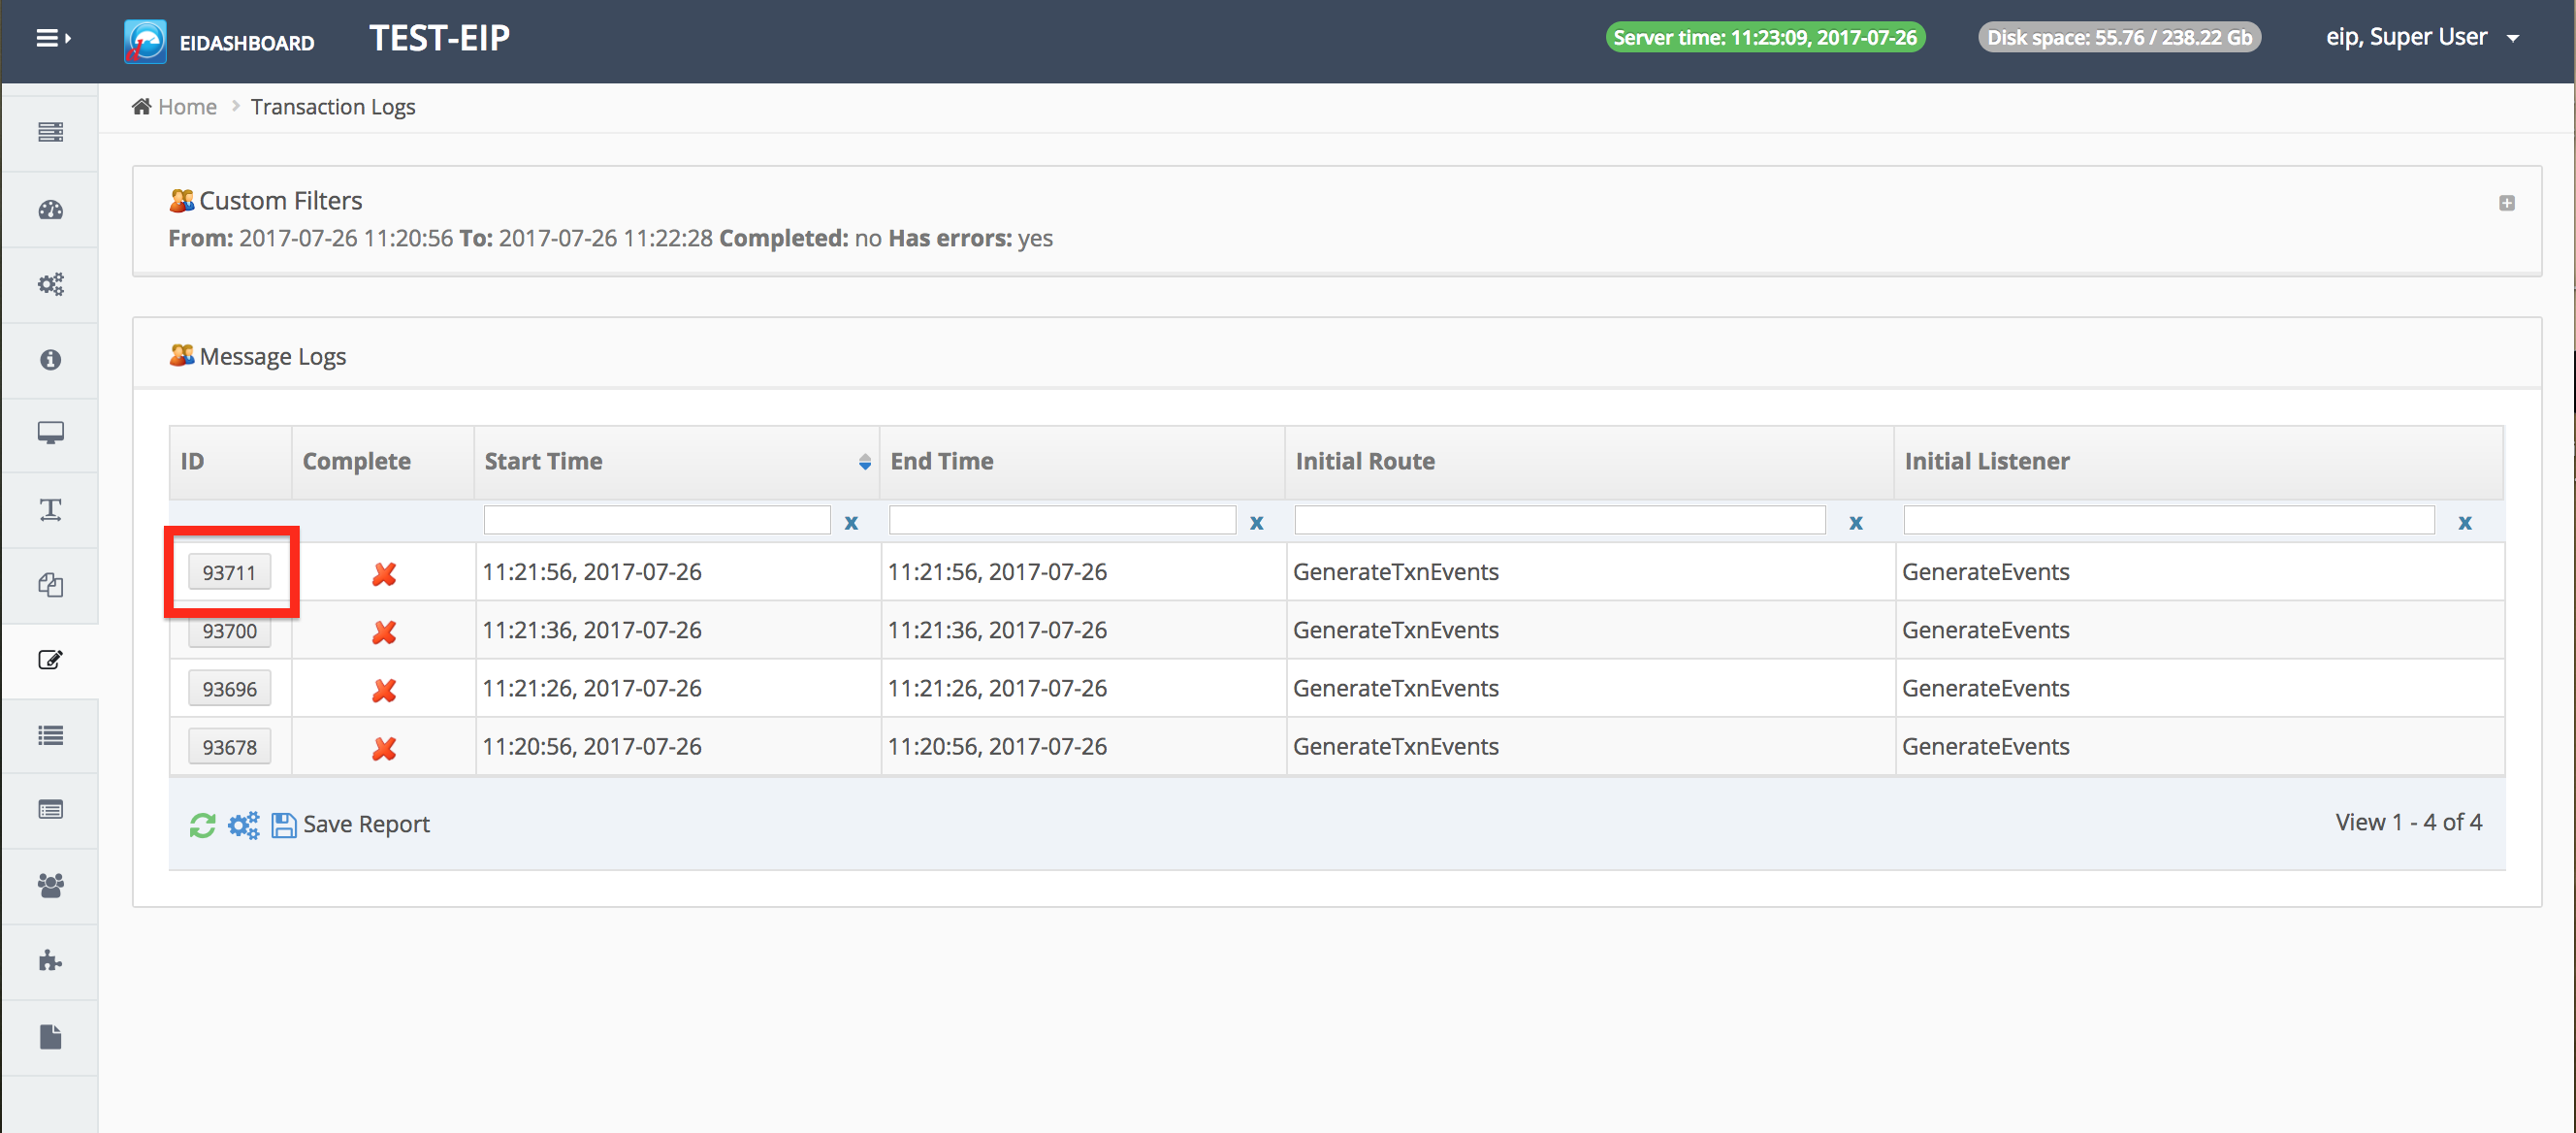
Hitting the ‘-‘ button in the top right of the Custom Filters box will compress it for easier viewing of the Message Logs table. The screenshot below shows the results of our search. Select one of the error logs for further analysis by clicking the box in the ID column.
Viewing Event Logs
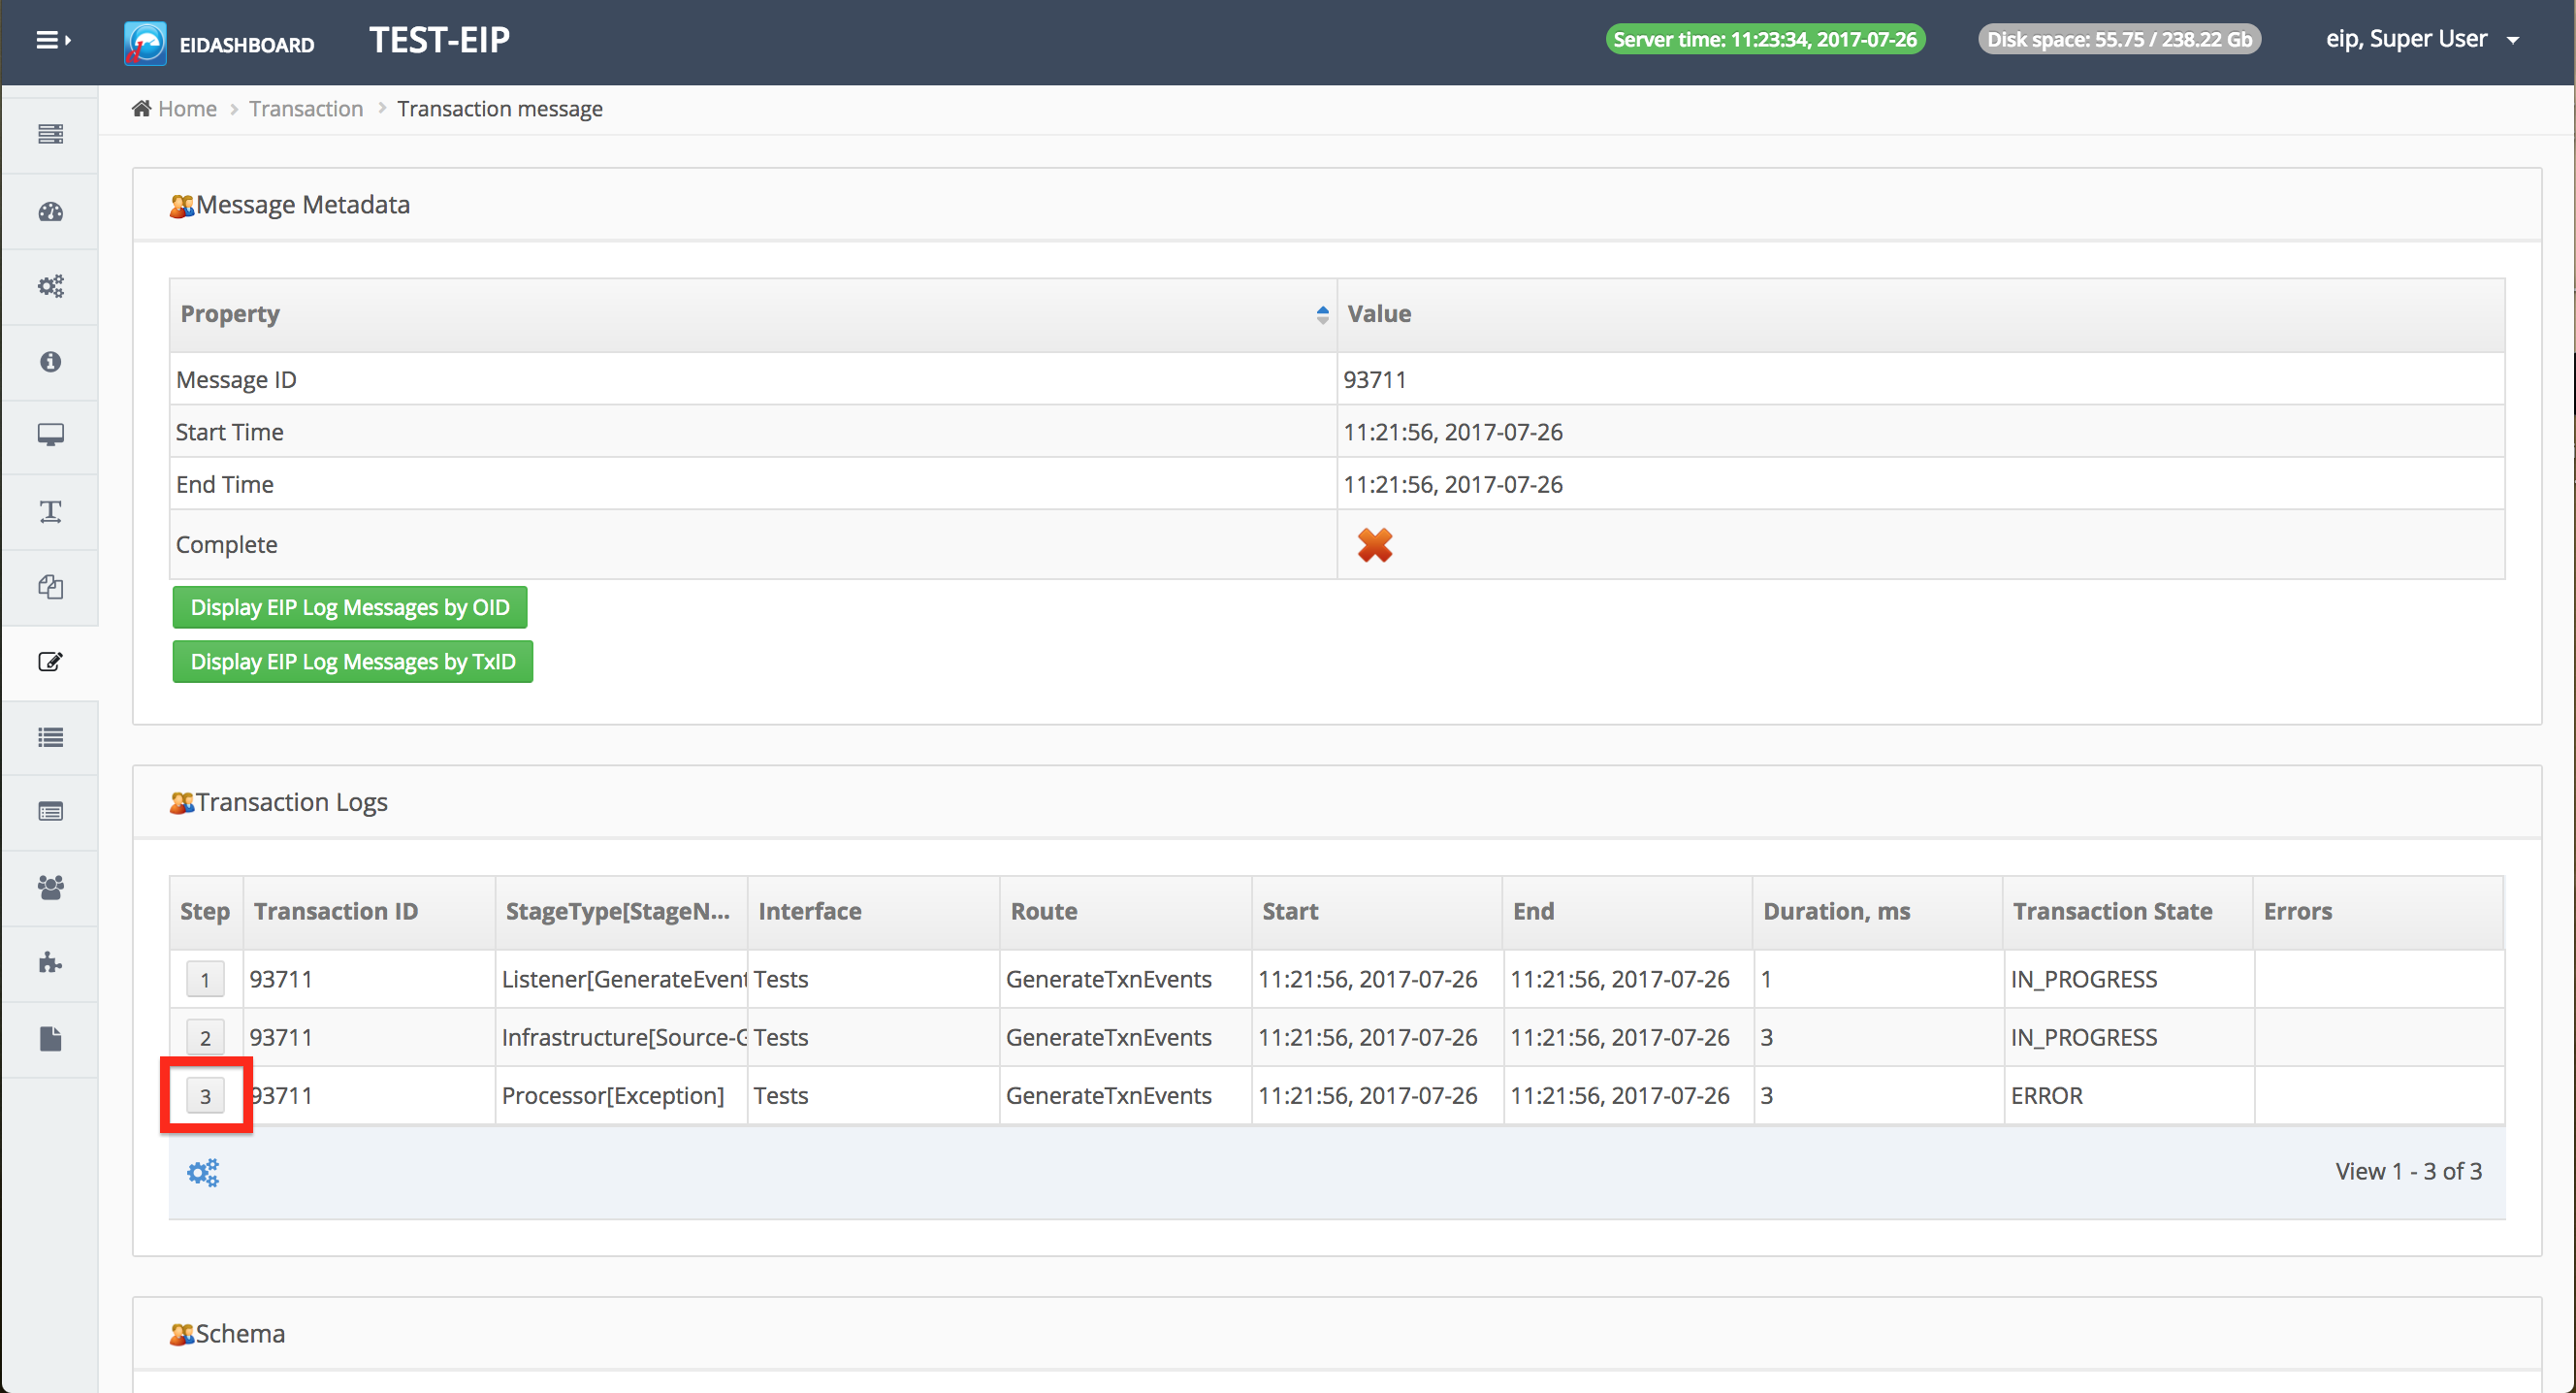
After selecting a transaction, we are directed to the Transaction Message page, which provides transaction at a deeper per-stage level. Each row in the table represents a single transaction stage and shows relevant information, including the stage’s current state. Selecting the buttons to ‘Display EIP Log Messages…’ by either OID or TxID will show any EIP log messages related to this transaction, which can be very helpful in diagnosing issues.
Looking at the screenshot below, we can see that this transaction did not complete and ended at the Processor stage – since it is the last one in the table and the state is ‘ERROR’. Select the box in the ‘Step’ column on the Processor row to analyze that stage even further.
Analyzing Transaction Event Logs
Once we’ve located the source of the problem, the next step is to find out what went wrong. From the Transaction Event Log page, the deepest levels of transaction detail can be explored. This page displays all relevant metadata for a transaction event, as well as transaction data and attributes at this point (if their logging is enabled). For our purposes, scroll down to the ‘Metadata’ table shown below.
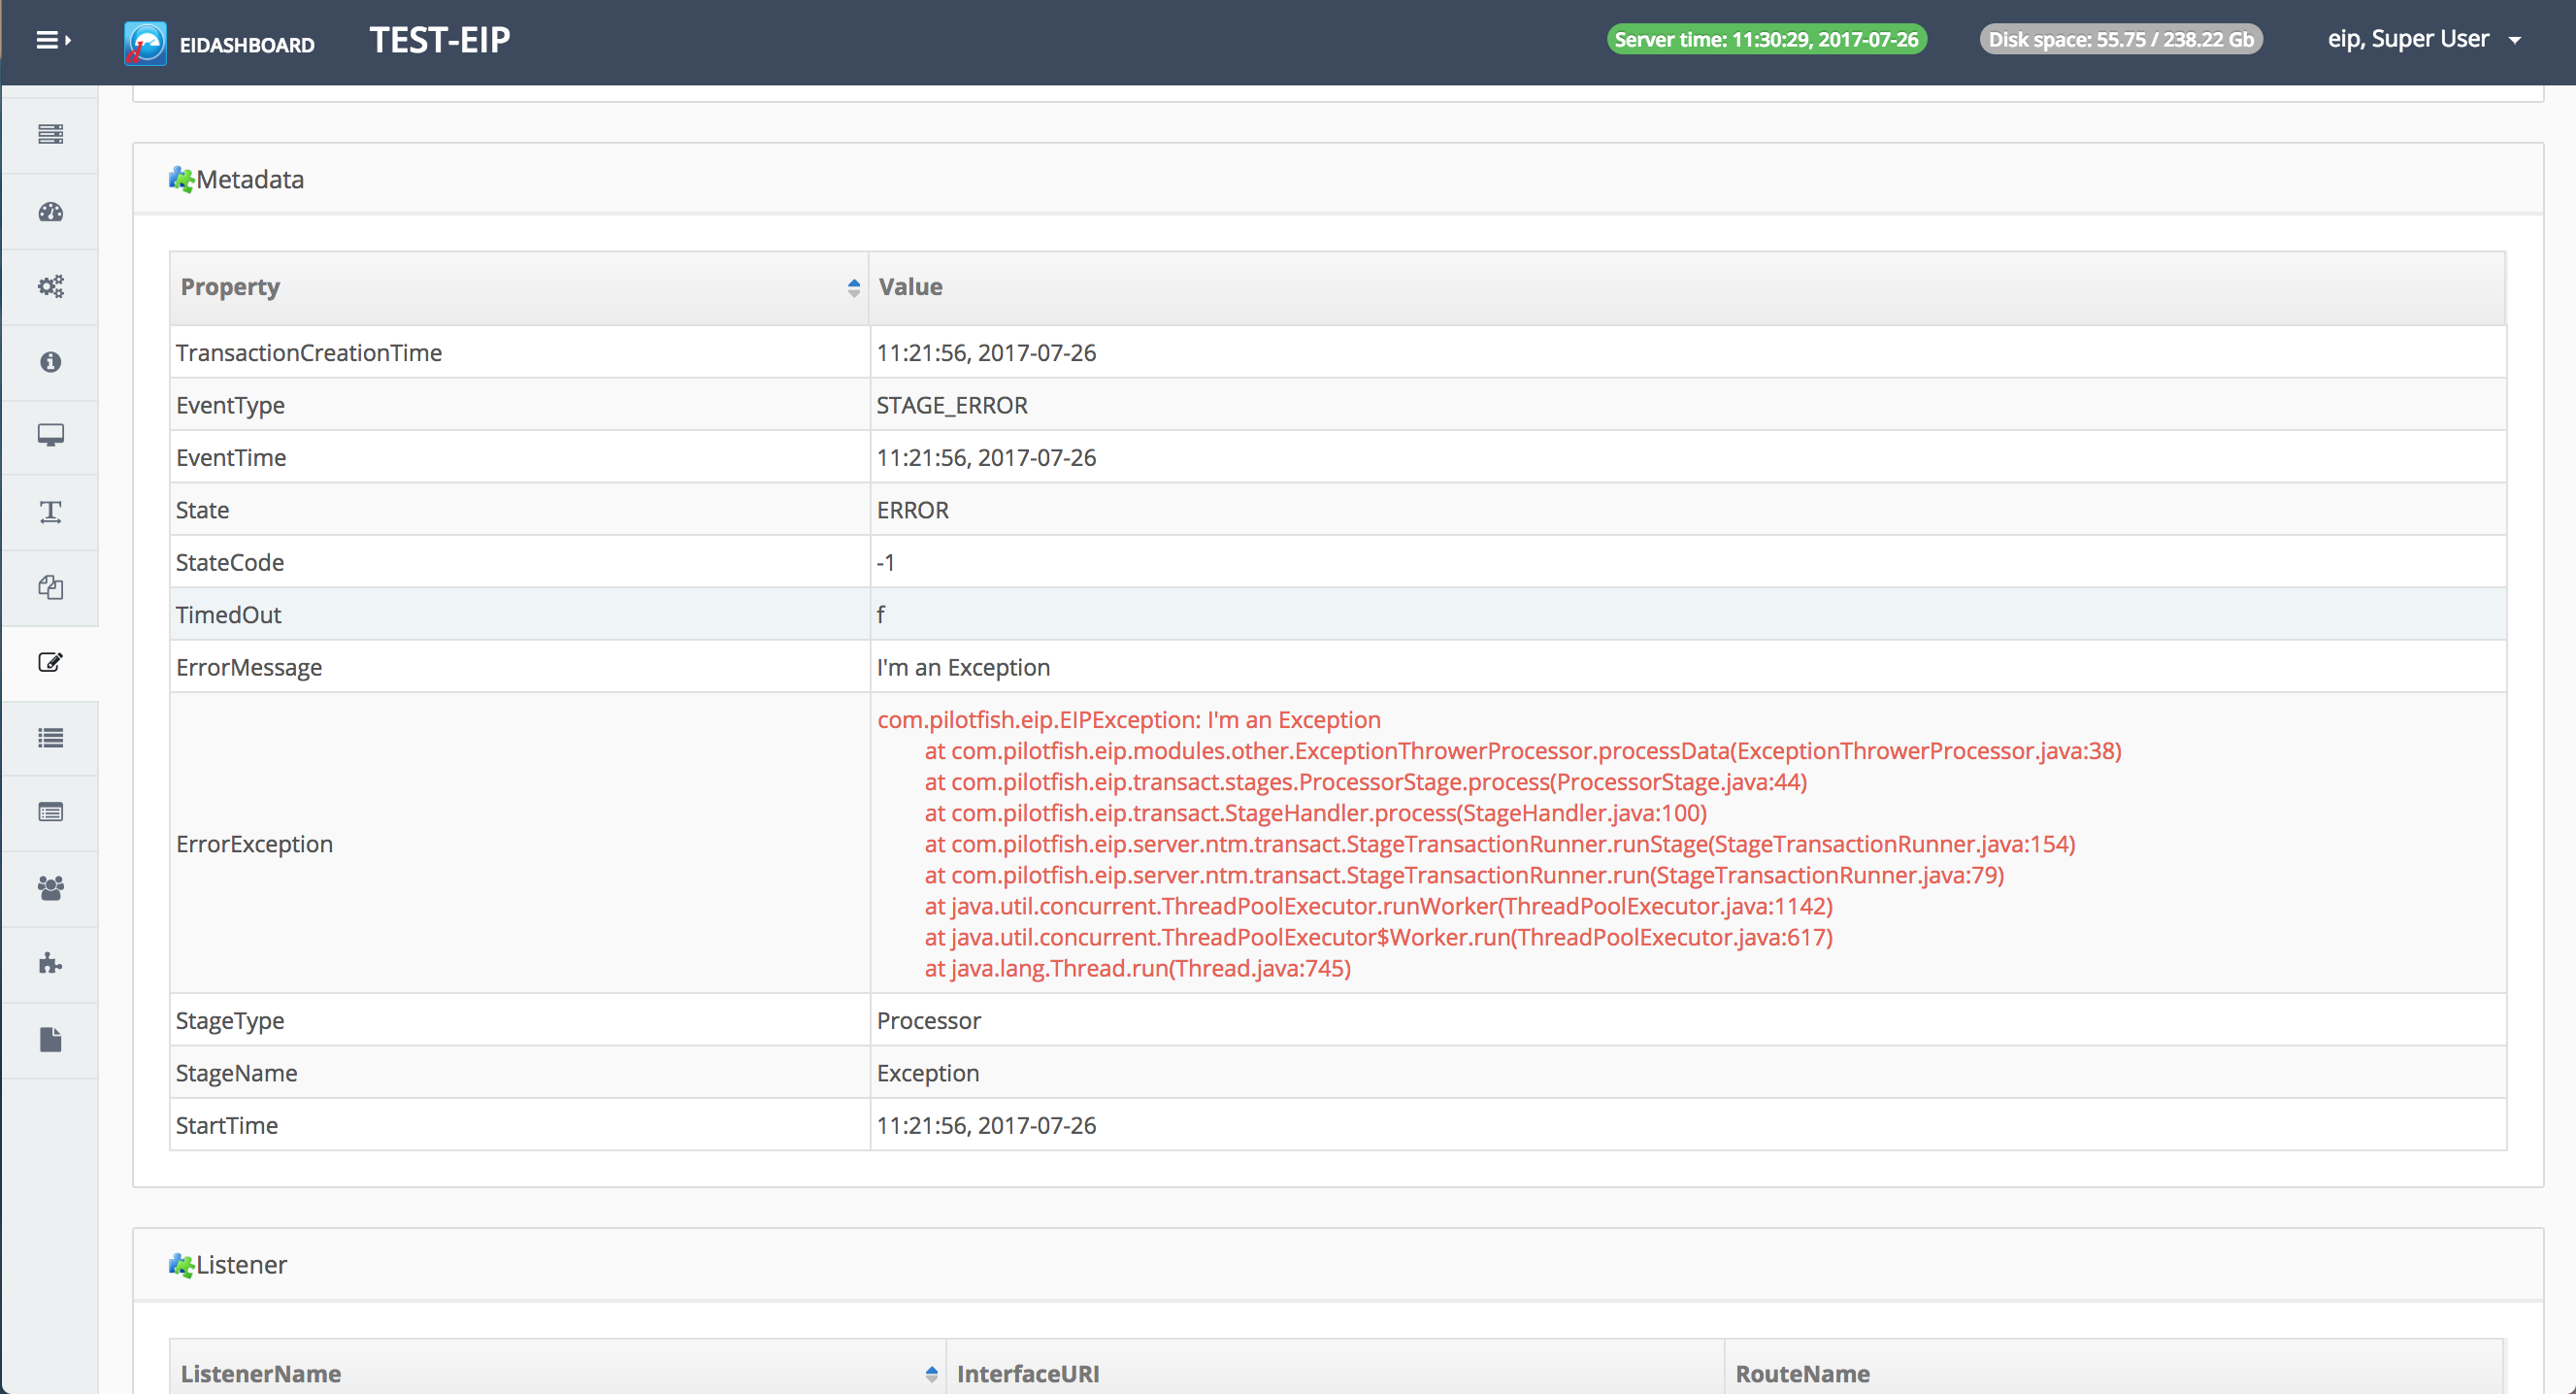
Here we see the reason for the error and where the error’s exception was thrown. This stack trace information is very helpful in determining whether the error was caused by bad input data, a faulty Interface, Route or something else.
Fixing the Problem
Now that we’ve identified the source of the problem, the next step is to fix it. Using the eiDashboard, we would:
- Stop the error-causing route from the Interface Status page.
- Export the bad components and fix them using the eiConsole.
- Redeploy the route back into the eiPlatform using the eiDashboard’s hot deploy functionality.
- Restart the components to resume normal operation.