eiDashboard v.19R1
Transaction Logging Mode – Installing & Configuring
This guide assumes you have already followed the instructions to install the eiDashboard in Basic Statistics Mode and are familiar with its operation and configuration. If you need to install the core eiDashboard, instructions can be found here.
Note: The process for enabling Transaction Logging Mode is the same whether using a Windows Service or Tomcat installation of the eiDashboard, and so this guide will cover both.
Recommended Installation Environment
- eiConsole and eiPlatform, at least version 19R1
- eiDashboard 19R1
- Apache Tomcat 7.0+ or 8.0+ (for Tomcat installations)
- Microsoft Windows 10 (for Windows installations)
- PostgreSQL 9.4+ or Microsoft SQL Server 2012+
Note: Transaction Logging Mode is driven by a back-end persistence of transaction events and other relevant information. The same interface configuration methods used in the eiConsole for building regular interfaces can be used to construct eiDashboard interfaces against a variety of database systems. Pilotfish provides a reference implementation for transaction event persistence using a PostgreSQL database, including schema and eiDashboard Interfaces and Routes. A Microsoft SQL Server implementation is also available.
Configuration Overview
Transaction Logging Mode vastly improves the granularity of the information available in the eiDashboard. With this mode enabled, individual transaction events are catalogued and data can easily be tracked as it flows from Source to Target. To facilitate this additional functionality, Transaction Logging Mode is supported by two main components that must be installed and configured. They are:
- A set of pre-designed eiPlatform Interfaces that gather, sort and format transaction information for use in the eiDashboard.
- A database back-end to persist this transaction information.
These pieces are meant to work in tandem, but can be tweaked individually to provide the desired level of performance vs. available information.
The overall configuration process to enable Transaction Logging Mode is broken down into four major steps, which are:
- Additional eiDashboard configuration settings
- Deploying and configuring the transaction logging interfaces
- Building the database schema
- Configuring transaction persistence
Note: Since the architecture required for Transaction Logging Mode is more extensive than Basic Statistics Mode, the installation process is also more complex. It is important to read each step thoroughly and to completion to ensure the smoothest installation process. This guide also assumes the eiDashboard is already properly installed and configured in Basic Statistics Mode.
Additional eiDashboard Configuration Settings
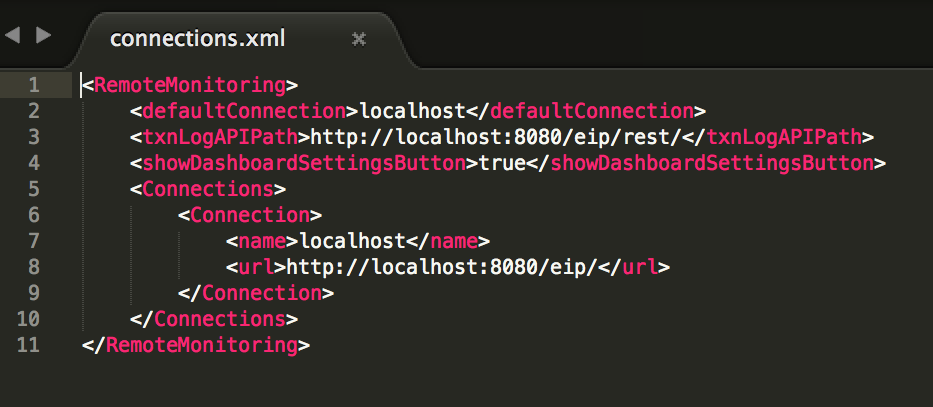
The first step in enabling Transaction Logging Mode is to check the Transaction API Path set in the eiDashboard’s connections.xml file, which is located at WEB-INF/connections.xml. This setting designates the URL of the eiPlatform’s API where the transaction logging interfaces are running. If the transaction logging interfaces will be deployed alongside your existing Business Routes and Interfaces, the URL will be the same as the one in the ‘Connection’ element with ‘/rest/’ added to the end. If the transaction logging interfaces are to be deployed to a different server, the API path will vary. An example connections.xml file from a Tomcat eiPlatform deployment is shown below.
Deploying and Configuring the Transaction Logging Interfaces
Design and Function
There are four primary Interfaces that drive the eiPlatform side of Transaction Logging Mode (listed below).
- Dashboard Interface: Contains the primary logic for transaction retrieval and formatting, as well as authorization handling when using Enterprise View Mode
- Maintenance Interface: Contains several maintenance-related routes
- Persist Interface: Contains routes to listen for transaction events and populate the Transaction Logging database
- Tests Interface: An interface for generating test transaction event
Obtaining the Interfaces
The Interfaces for the eiPlatform side of Transaction Logging Mode can be obtained in the following ways:
- With the Windows eiDashboard installer
- If using a Tomcat or other eiDashboard deployment, and do not have the interfaces, please contact PilotFish support to obtain it.
Deploying the Interfaces
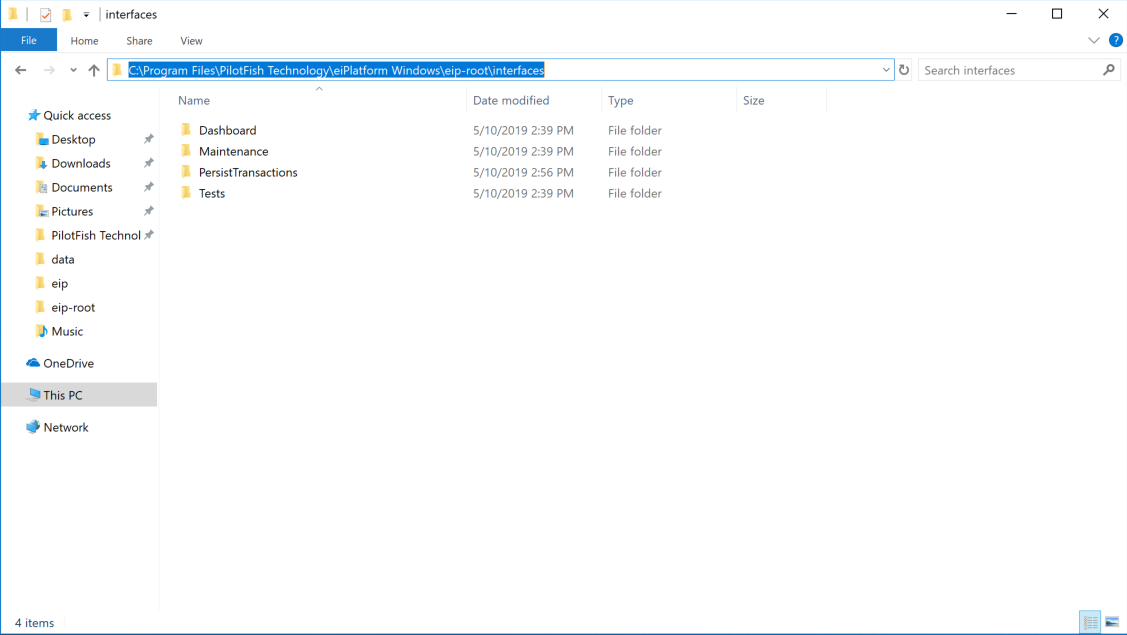
Typically, the Transaction Logging Interfaces are provided in the installer along with the database schema and applicable JDBC driver. During installation you should have been prompted to install the interfaces to an eip-root location. To start, open your eiConsole and select the working directory where the interfaces will be run (the eip-root directory for your eiPlatform). The default install location will vary depending on your eiPlatform installation, but will generally be placed in the root interfaces of your eiPlatform.
Interface Configuration
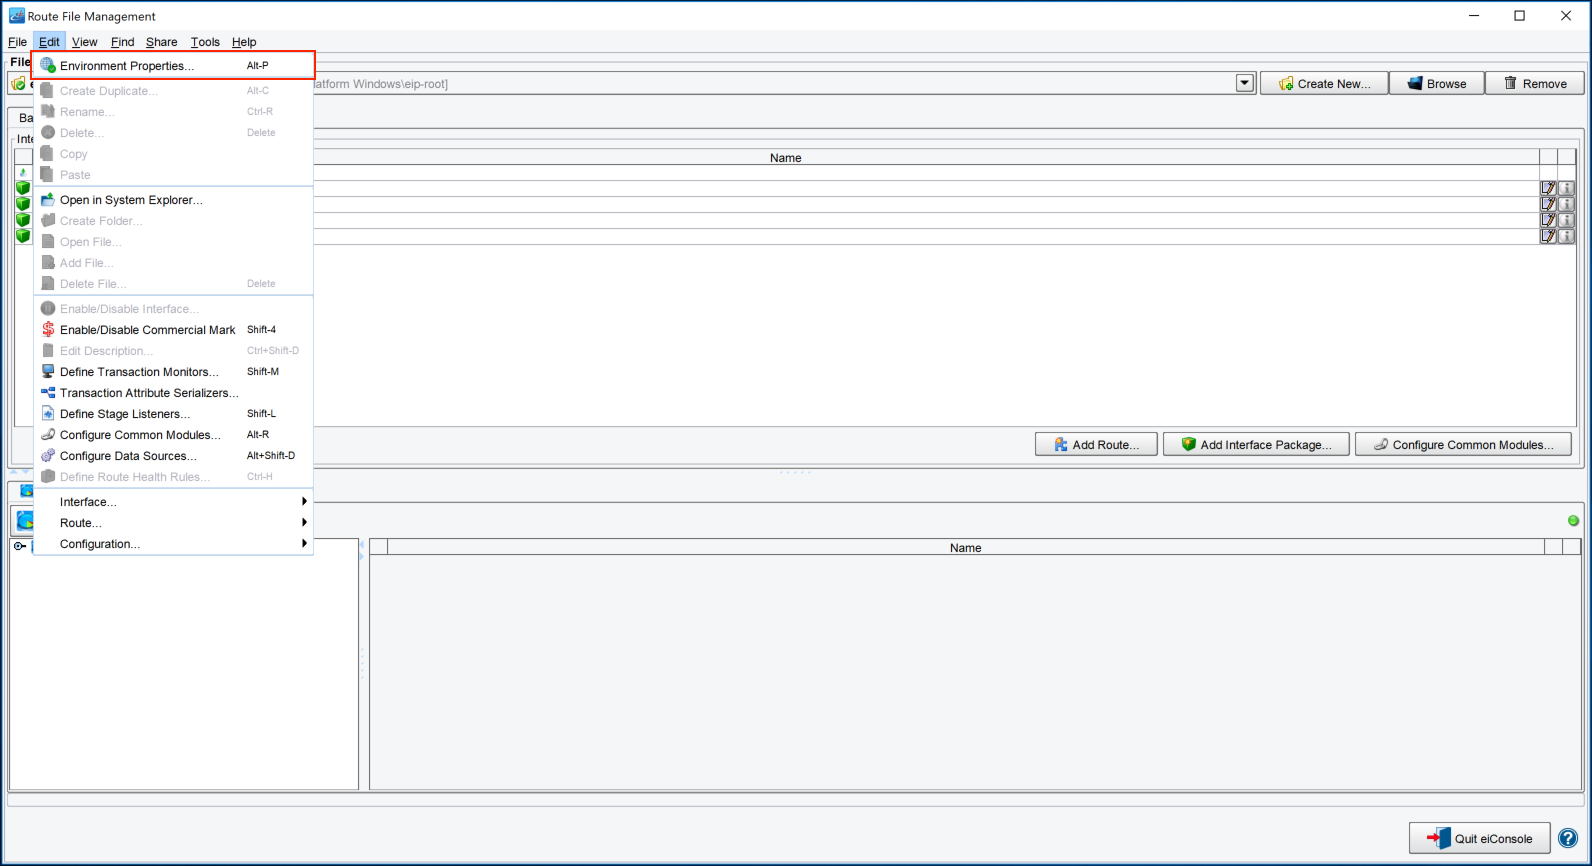
All the required configuration settings for the Transaction Logging interfaces are stored as environment properties. To change the properties for a particular interface, simply navigate to the interface in the Route File Management screen and go to ‘Edit -> Environment Properties…’ in the menu.
There are two pieces that will require configuration and we will go through each in turn.
Transaction Log Pruning Time
This setting is located in the Maintenance interface and tells the eiDashboard how long to store transaction events. It defaults to 30 days, meaning that any transaction events older than 30 days will be automatically pruned from the database.
Database Connection Settings
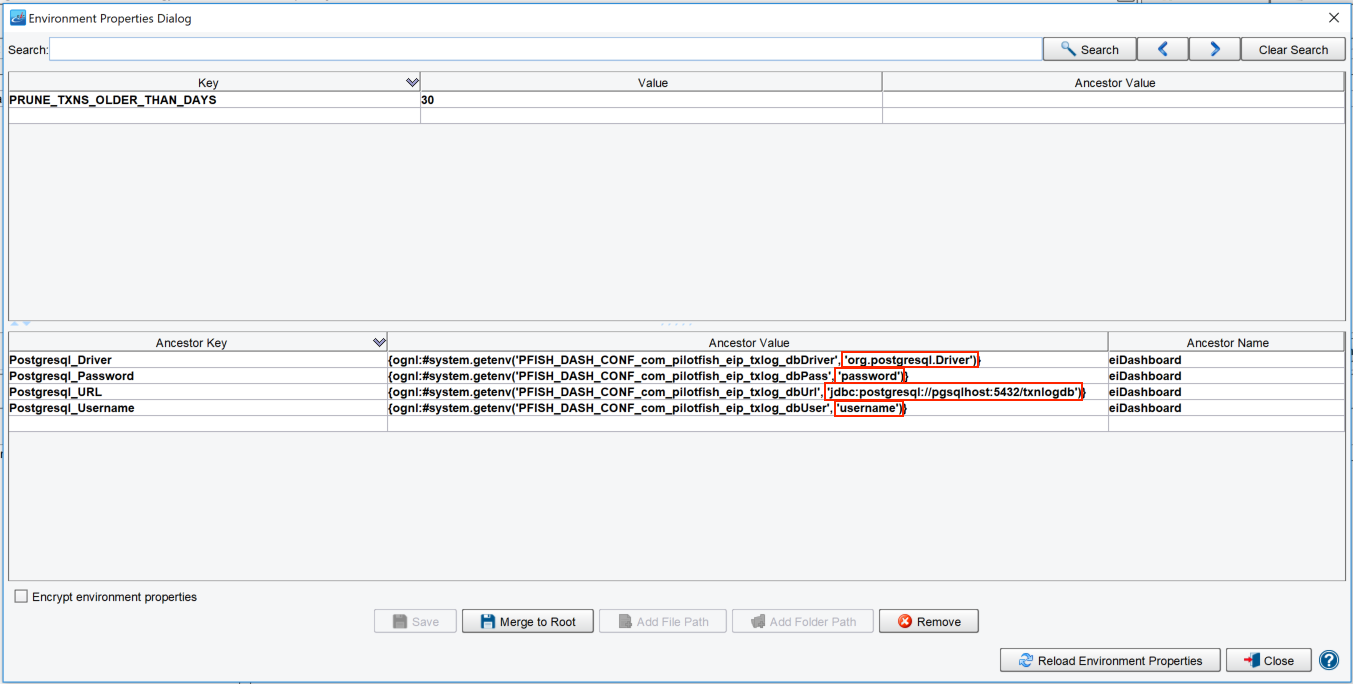
These consist of four settings needed for the eiPlatform to connect to the Transaction Logging database: the username, password, JDBC Driver name and JDBC URL. These settings will vary depending on your individual database setup, but for a typical PostgreSQL setup the JDBC Driver is ‘org.postgresql.Driver’ and the URL is ‘jdbc:postgresql://<Database Host>:5432/<Database Name>’. An example Environment Properties screen showing these settings is below:
Building the Database Schema
Design and Function
The Transaction Logging database’s primary function is to store information about transaction events and catalog it in an easily retrievable way. Once configured, the database also stores user and eiPlatform information for use with Enterprise View mode. As mentioned previously, PilotFish supplies a reference implementation written for PostgreSQL. The installation instructions will be the same regardless of the database system used; all that will change is the contents of the database schema and the JDBC settings used to connect the eiPlatform to the database.
Building the Schema
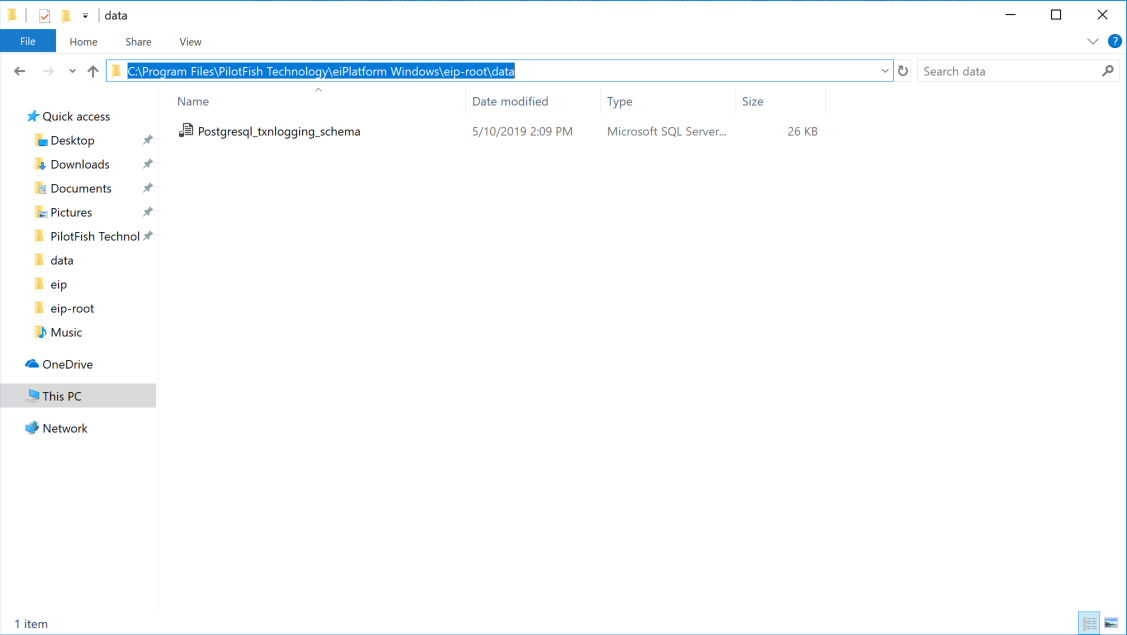
The first step in setting up the database portion of Transaction Logging Mode is building the database schema. How this is done will depend heavily on your network and database systems, but generally all that is required is to import/copy-and-paste the appropriate .sql schema into your database’s query tool and execute. You can find the schema in the data folder which is installed alongside the eiDashboard interfaces.
JDBC Library Import
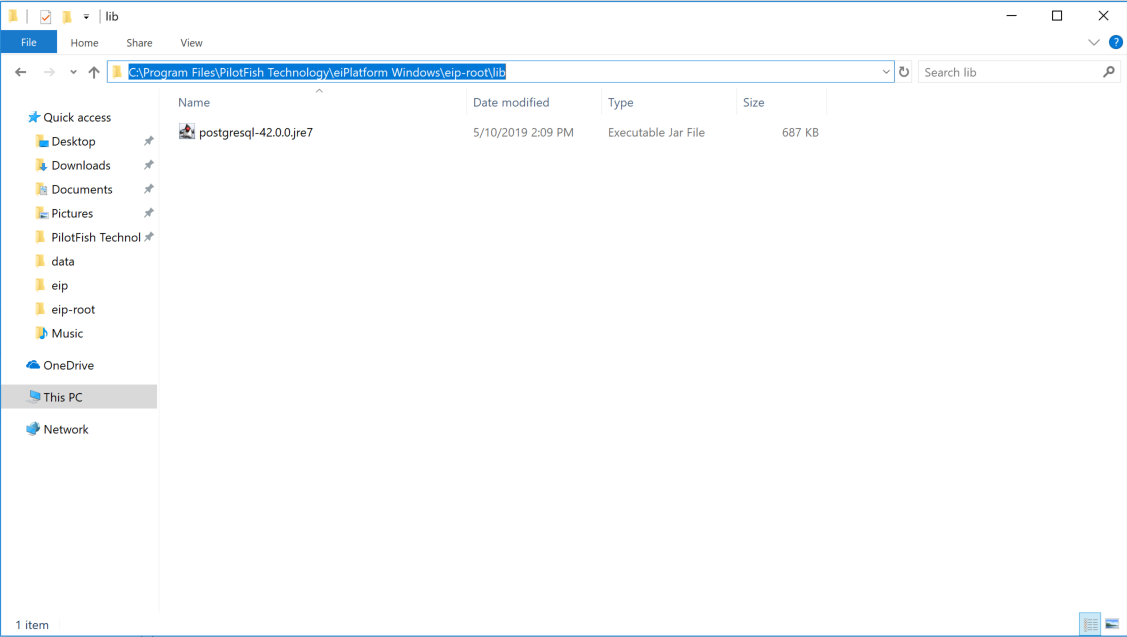
The final step in configuring the database for use with Transaction Logging Mode is to import the necessary JDBC driver into the eiPlatform’s working directory. For a standard installation, we have provided the proper PostgreSQL JDBC driver (postgresql-42.0.0.jre7.jar). The JDBC driver (should be installed automatically, but double check) needs to be placed into the root /lib directory of your eiPlatform’s root working directory, similar to how other custom eiPlatform modules are deployed.
Activating Transaction Persistence
Once the Transaction Logging pieces are in place, we need to configure the level of persistence for transaction events. Since we track transaction events using a modified eiPlatform Listener module, it is easy to configure the level of granularity.
Selecting Events and Stages to Persist
The first step in this process is to configure the Transaction Event Listener in the Transaction Logging Interfaces. Using the eiConsole, open the Working Directory where your interfaces are located. Open the ‘PersistTransactions’ interface and then the ‘PersistTransaction’ route.
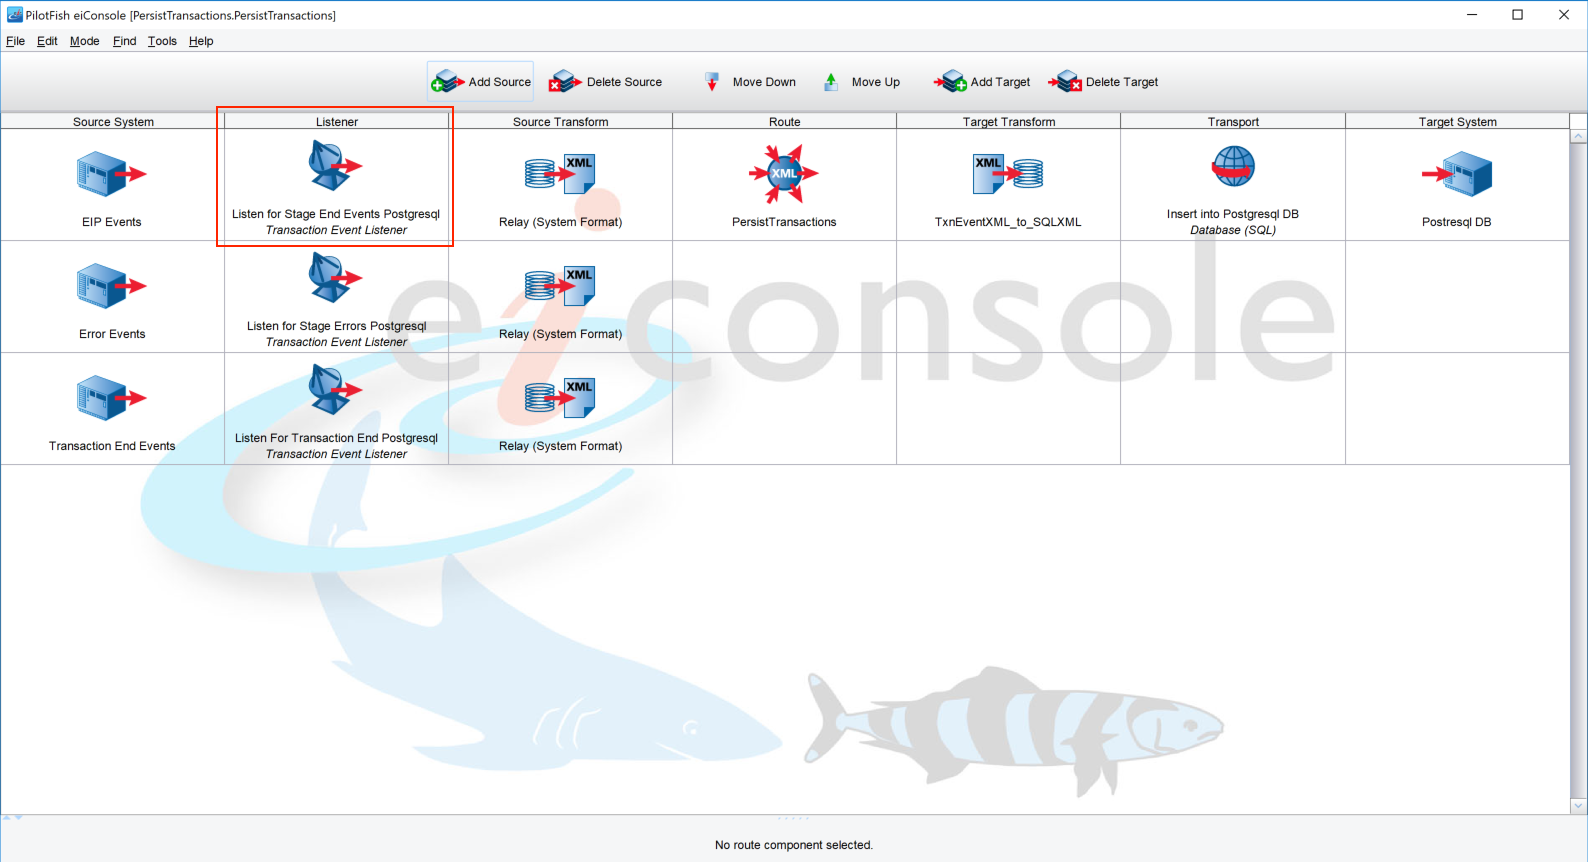
This route contains three Transaction Event Listeners – one to be configurable, another to capture only transaction events with errors and one to capture completed transactions. Select the top-most listener named ‘Listen for Stage End Events’ and the listener configuration will display. The first two tabs are the ones we will need to configure: Event and Stage. The Event tab is shown below.
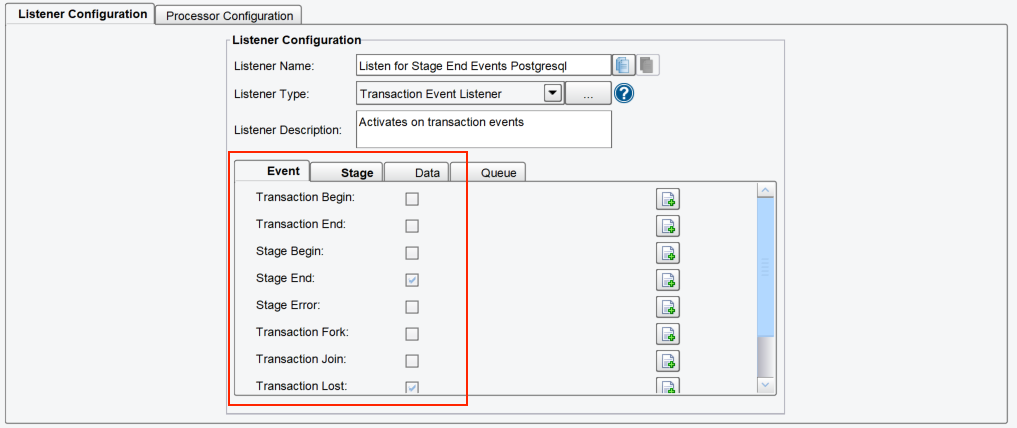
Using the Event tab, you can select which transaction event types you would like to persist. To help minimize the size of the database, we recommend the default selection (Transaction End, Stage End, and Transaction Lost). This will generate one event for each transaction ending, one for the end of each stage (8 stages per route) and one for any Transactions that might get lost.
Remember: The second listener will listen for all Stage Error events, so those are not needed here.
Next, select the Stage tab, which shows the Stages that will be listened on. Listeners and Transports are selected as a default, though any stage can be tracked and stored by selecting it.
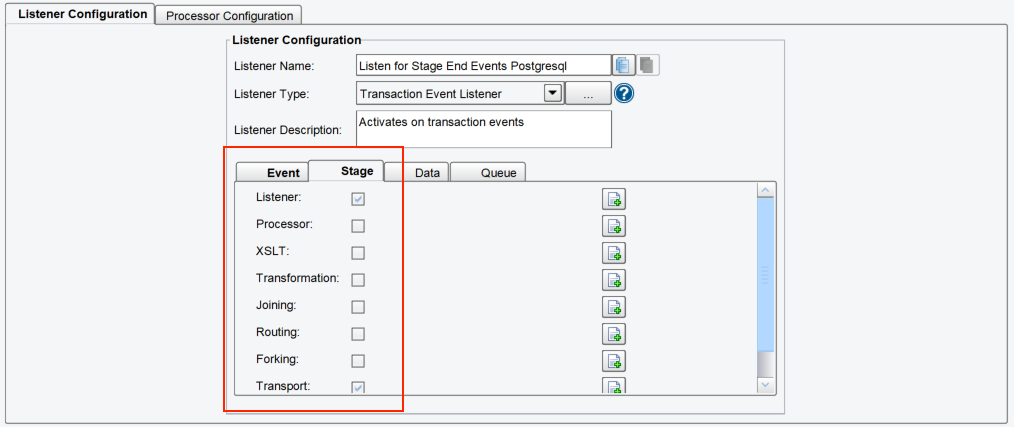
Note: The Stage Error listener listens on all stages by default, so no error will be missed.
Configuring Listeners to Report Events
After configuring the Transaction Event Listener, we must now select which listeners we would like to broadcast transaction events. This gives an easy way of making sure only the routes that you want information about will generate transaction events for the listener to pick up, while listeners that are less important are ignored. Every listener in the eiPlatform (Directory, Database SQL, RESTful, etc.) has additional configuration settings available to define the type of transaction events it will broadcast. The screenshot below shows the Transaction Logging configuration on an example listener:
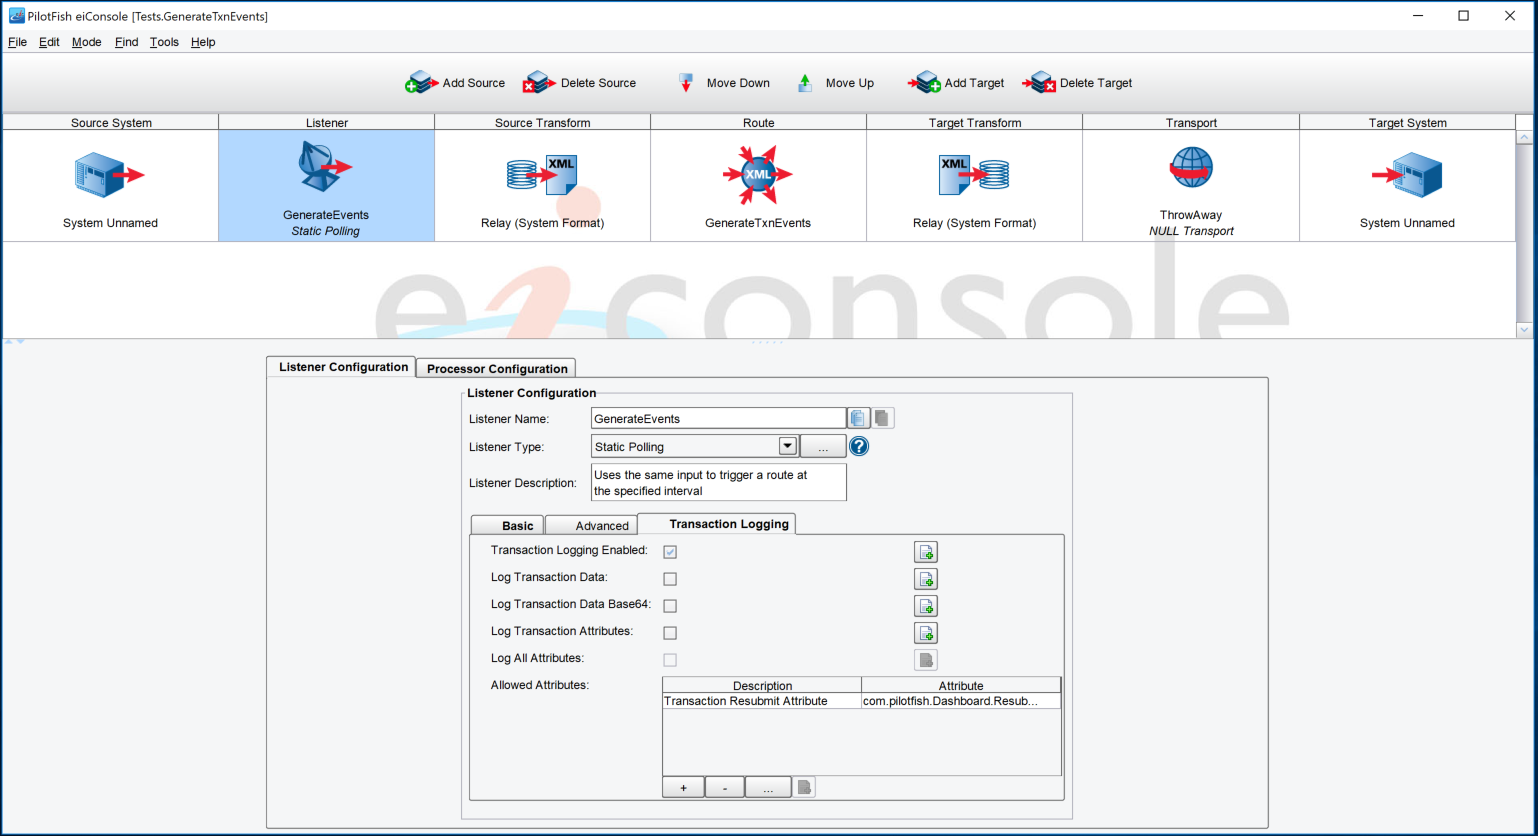
Selecting ‘Transaction Logging Enabled’ will tell this listener to broadcast events for all the transactions that it starts. If attribute and data storage is desired, select the appropriate options. You may also restrict transaction attributes from being logged in this configuration. It is recommended to only log those attributes which are required as they can fill up a database quickly.
Wrap-Up
At this point, Transaction Logging Mode is ready to go! When logging into the eiDashboard, you should see additional navigation menu options for ‘Transaction Logs’ and ‘Reports’, as well as enhanced detail on the ‘Interface Status’ screen.
For more information on the enhanced functionalities of Transaction Logging Mode, see the link for eiDashboard – Modes of Operation.
Troubleshooting
This section provides some solutions for common issues that can arise when configuring Transaction Logging Mode. Typically, issues enabling Transaction Logging fall into two categories: database issues and connection issues.
Database Issues
If you find that Transaction Logging Mode is properly enabled but the transaction logs are empty, there may be an issue with the connection to the database.
- Make sure the proper JDBC library for your database system is imported into the /lib directory of your eiPlatform’s root. Drivers for Microsoft SQL Server, MySQL, Oracle, etc. must be obtained from that provider to be able to successfully connect from the eiPlatform.
- Double-check the database connection settings. Often a mistyped URL or driver name can result in connection issues and the URL syntax can vary depending on the JDBC Driver used.
Connection Issues
If Transaction Logging Mode is not enabling after following this configuration guide (ie. the ‘Transaction Logs’ and ‘Reports’ tabs are not available), the most common solution is to check the connection settings.
- Double-check that the connections.xml file contains the correct settings and values, especially the Transaction API Log Path. The ‘txnLogAPIPath’ setting should point to the eiPlatform API where the transaction logging interfaces are deployed.
- The eiPlatform will require a restart after importing the JDBC driver or changing any of the environment properties in the Transaction Logging Interfaces.
