eiDashboard v.20R1
eiDashboard – Transaction Logging
This page will take you through the configuration of eiPlatform Routes using the eiConsole to enable transaction logging.
It is assumed that at this point there is a successful installation of an eiDashboard and a monitored eiPlatform running functional routes and Interfaces.
Configuring the Persist Transactions Interface
With every eiDashboard install comes a set of interfaces and routes used by the eiDashboard to communicate with a database.
The interfaces are typically split into those which run on the back-end eiDashboard eiPlatform and those that run on a monitored eiPlatform.
That is:
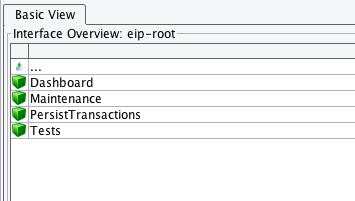
Back-End EIP
- Dashboard
- Maintenance
Monitored EIP
- PersistTransactions
- Tests (Optional)
For the purpose of this guide, the focus will be on the two interfaces found in the Monitored EIP section as the Dashboard and Maintenance interfaces are strictly used for the functionality of the dashboard.
Persist Transactions Interface
Diving into the PersistTransactions interface will reveal a PersistTransactions route.
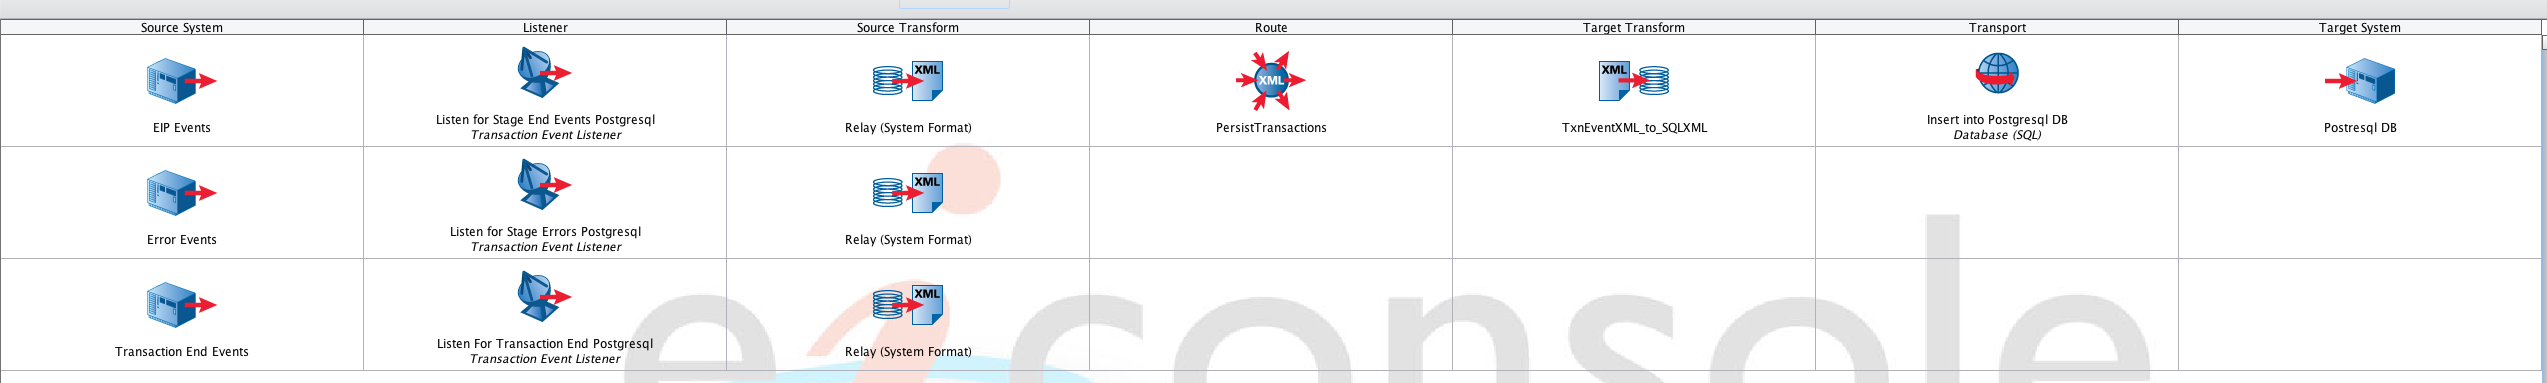
This route contains three Transaction Event listeners:
- Listen for Stage End Events
- Listen for Stage Errors
- Listen for Transaction End
Listeners 2 and 3 should never be touched unless explicit behavior is required. The defaults should suffice for almost every case.
However, Listener 1 can be configured to alter the granularity of Transactions that get logged into the database.
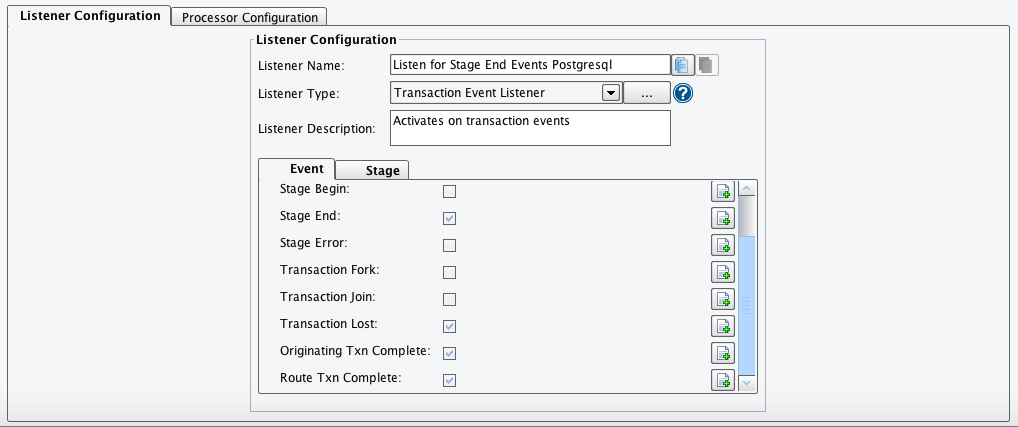
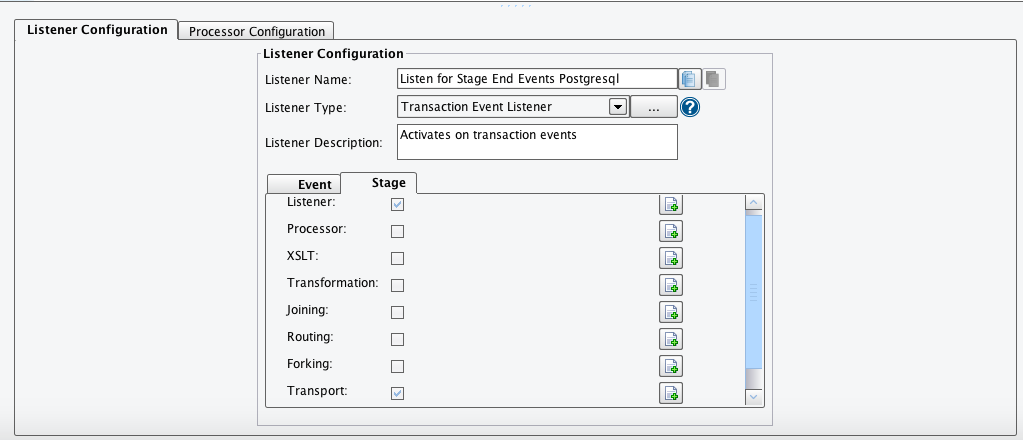
As seen above, by default, only stage end and some infrastructure events are logged for only Listeners and Transports. These are the minimal pieces of information that an eiDashboard needs to create an understanding of how transactions flow through PilotFish routes. Again, the defaults here are recommended and at a minimum they are required. Feel free to add extra event types and Stages to this if you would need to gain that level of granularity between stages. However, please note that doing so will cause a performance hit. For each extra stage and event type that gets logged, you can assume there to be a noticeable amount of overhead.
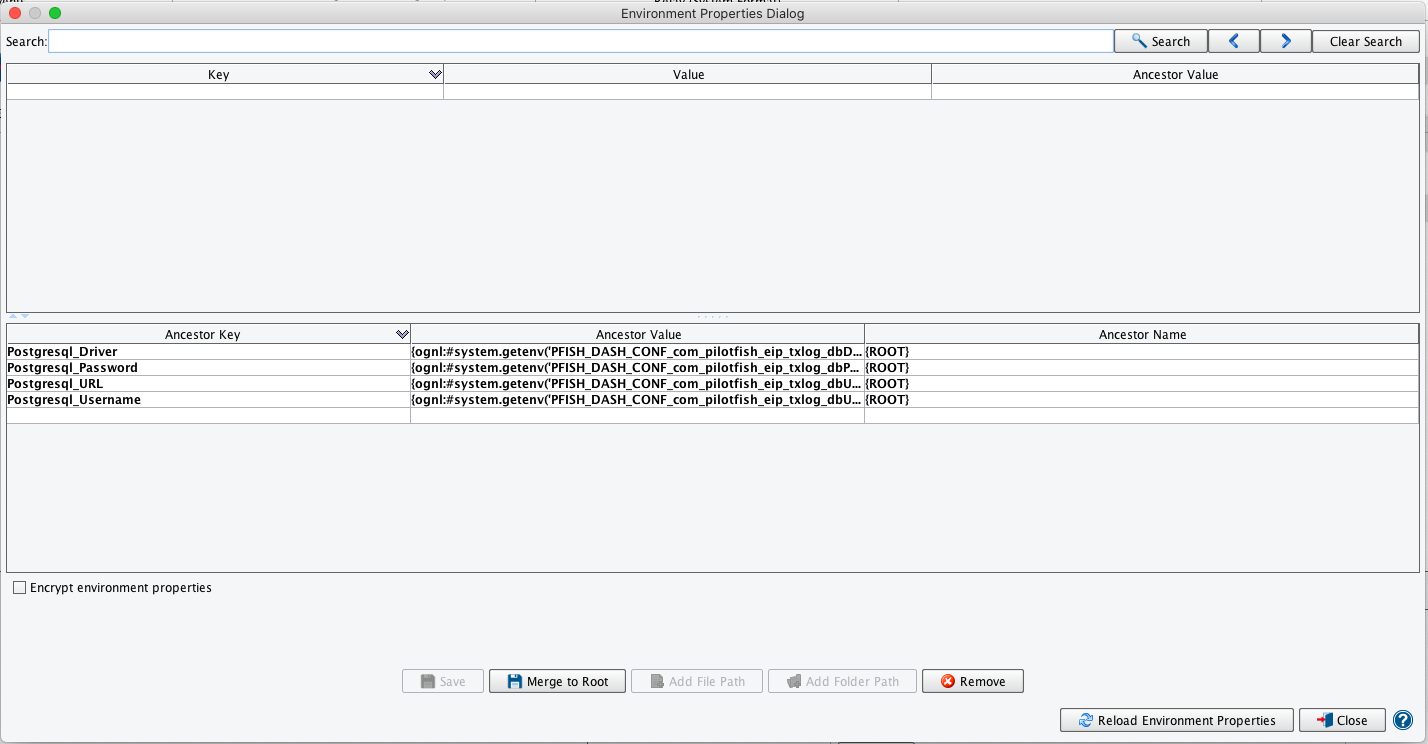
The actual insertion of Transaction Events is done so by taking the incoming event from the listener, converting that into SQLXML and inserting it into the Target database via SQLXML Transport. The configuration for the transport uses the same environment properties installed with the eiDashboard back-end routes. These can be copied into the persist transactions interface.
Tests Interface
The Tests Interface simply provides an example of a transaction logging enabled route as well as a way to confirm your Persist Transactions interface is correctly configured. This interface can be removed after confirming transactions are being inserted into the database.
Configuring Listeners for Transaction Logging
Every listener has a Transaction Logging tab. This tab allows you to enable logging for only transactions originating from that listener. At this point, you can also control whether or not to log the transaction data, to base64 encode it (for binary data) and whether or not to log attributes.
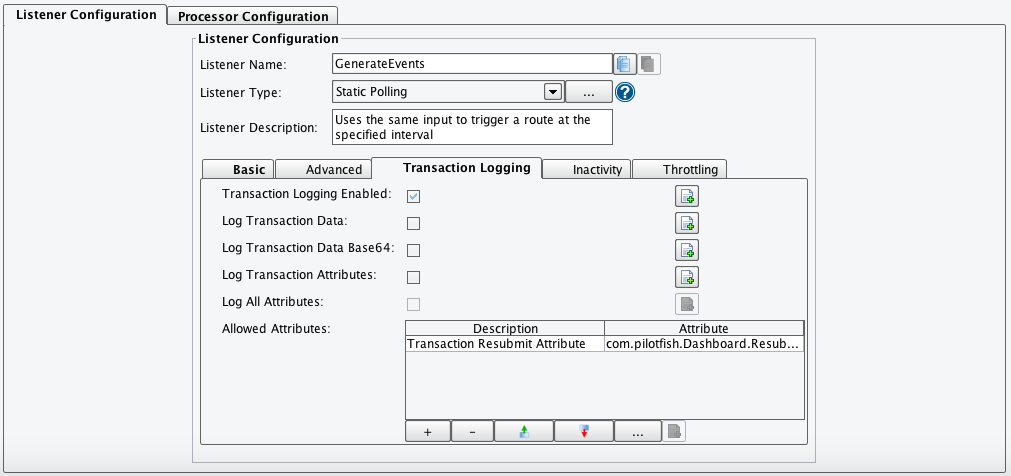
You may notice that everything has to be explicitly enabled. This is the default setting so that you are only logging what is intended. Every bit of information that you log can cause a performance hit so the defaults are extremely constrained to prevent any unnecessary or unintentional logging. To have a ‘completed’ transaction log, there must at least be a Listener and Transport logged during the lifetime of a transaction. Any route callouts that happen will also need transaction logging enabled on those listeners.
Important Note
Again, it is recommended to log only what is needed. There is the ability to log all transaction attributes, but it is not recommended. You should only log transaction attributes that do not have dynamic attribute names as this can cause the database to grow very large, very fast.
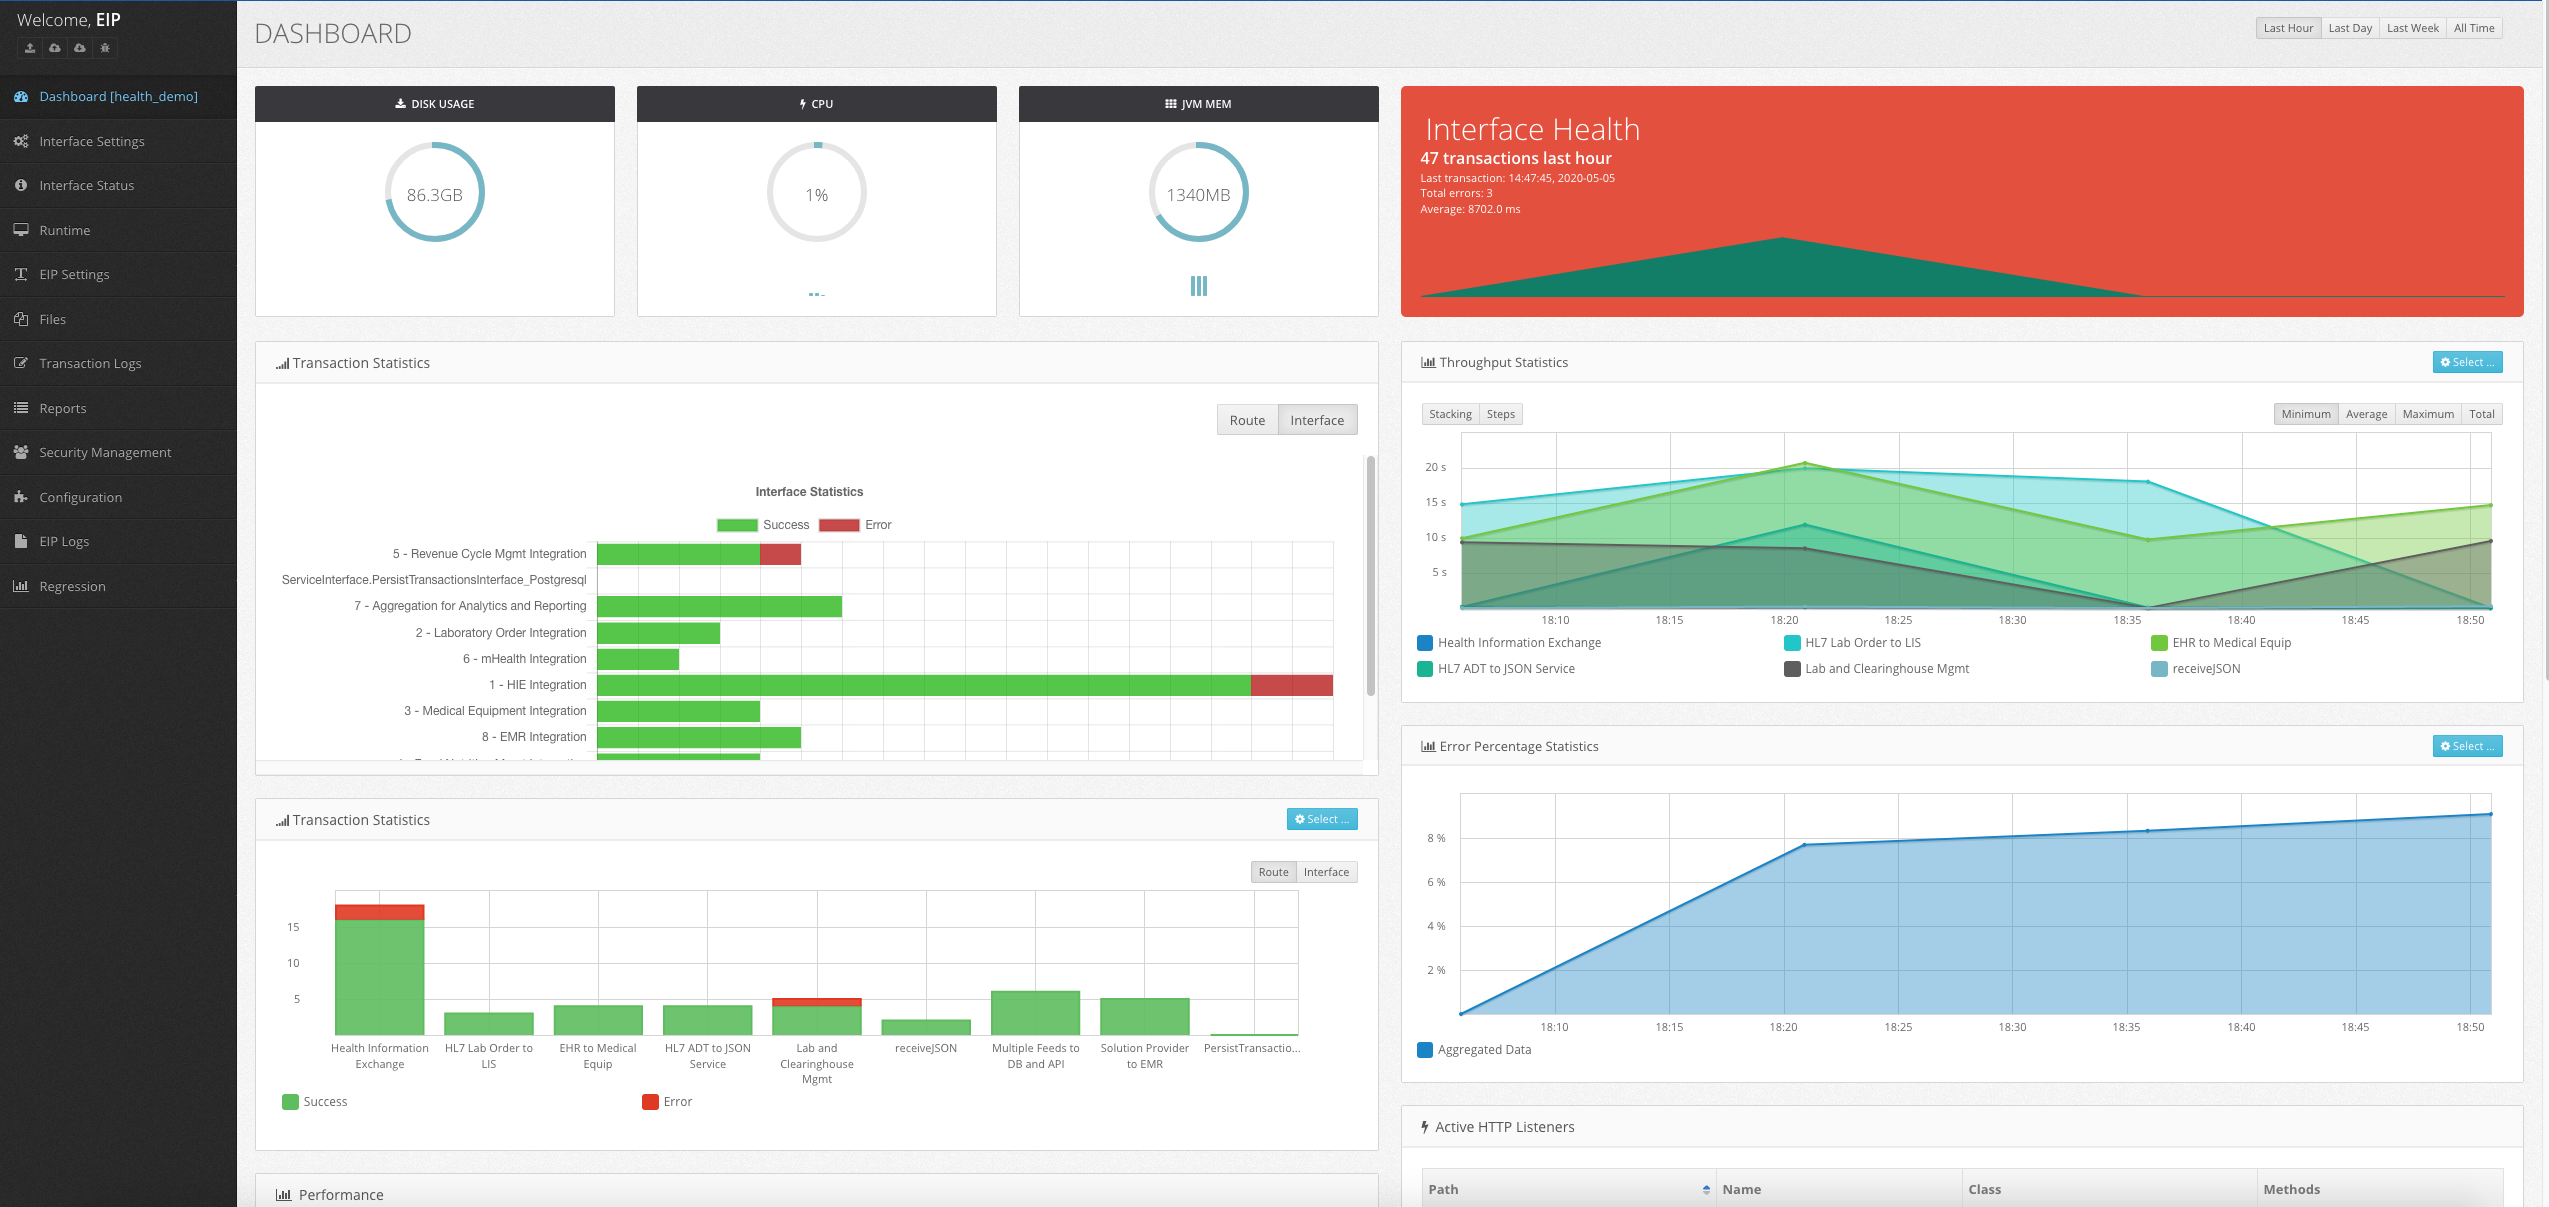
Transaction Logs in the eiDashboard UI
When you’ve configured your interfaces to persist to the database successfully, you can see the data in the eiDashboard webpage. On the main Dashboard page you can see some general statistics in the widgets:
If you need to do a deeper dive on your logged transactions, navigate to the Transaction Logs tab.
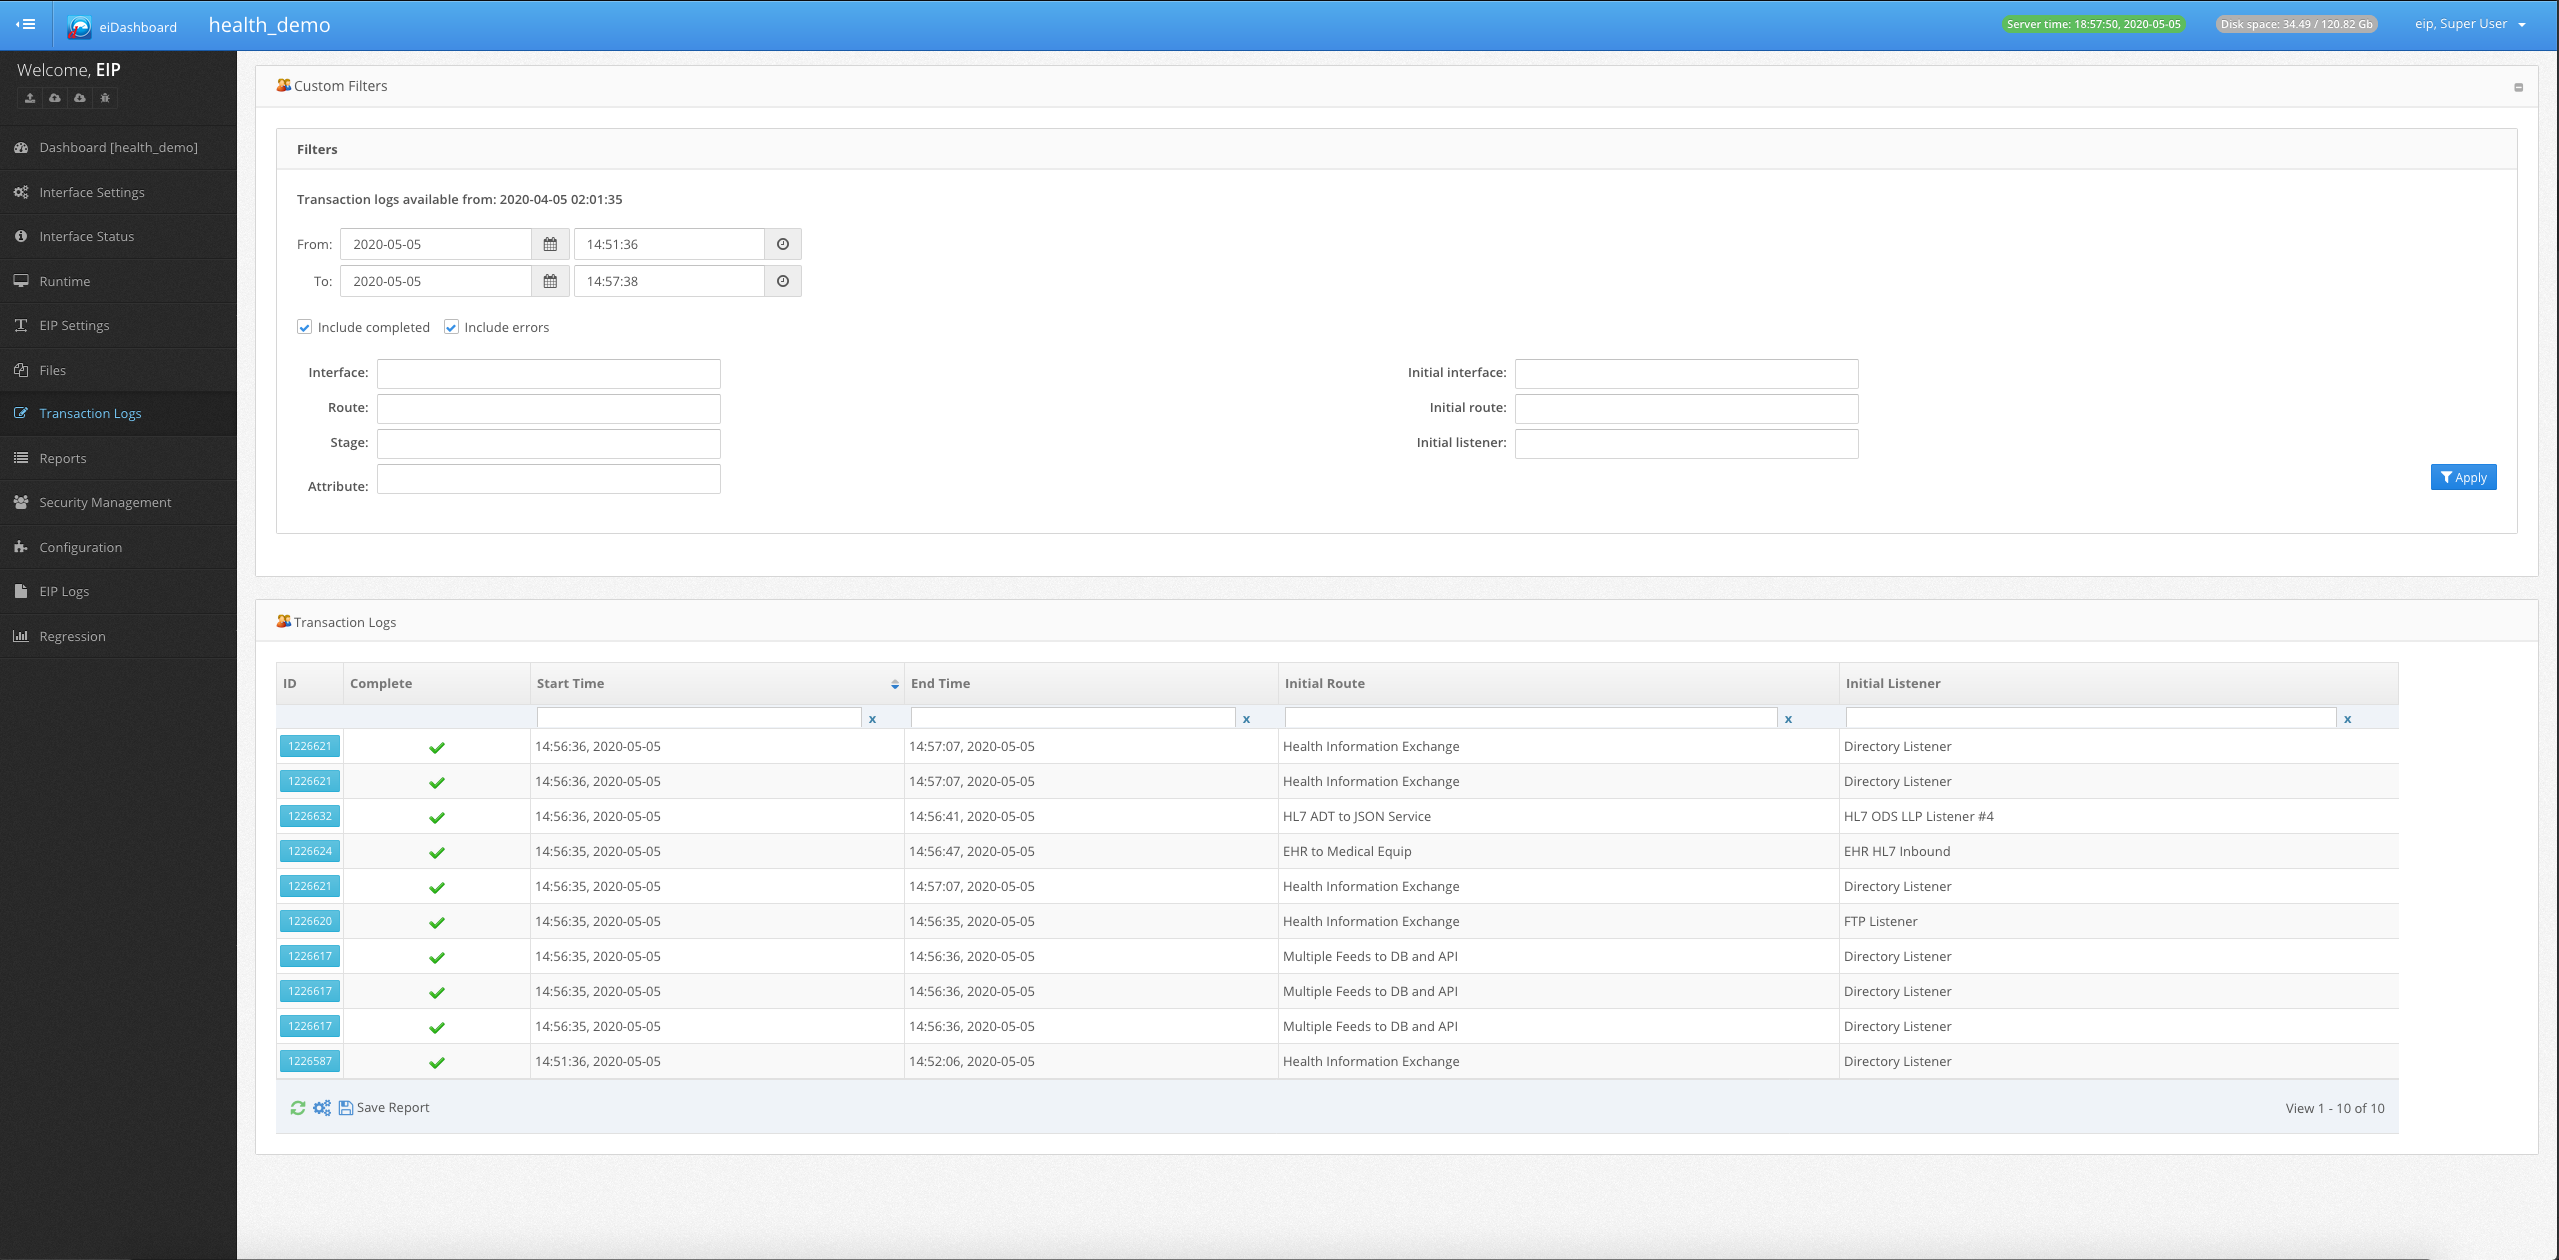
By default, it will show the 10 most recent transactions. You can use the filter options above to search for more specific transactions. Clicking on the blue button with a transaction ID in the table will dive you deeper into the logged transaction.
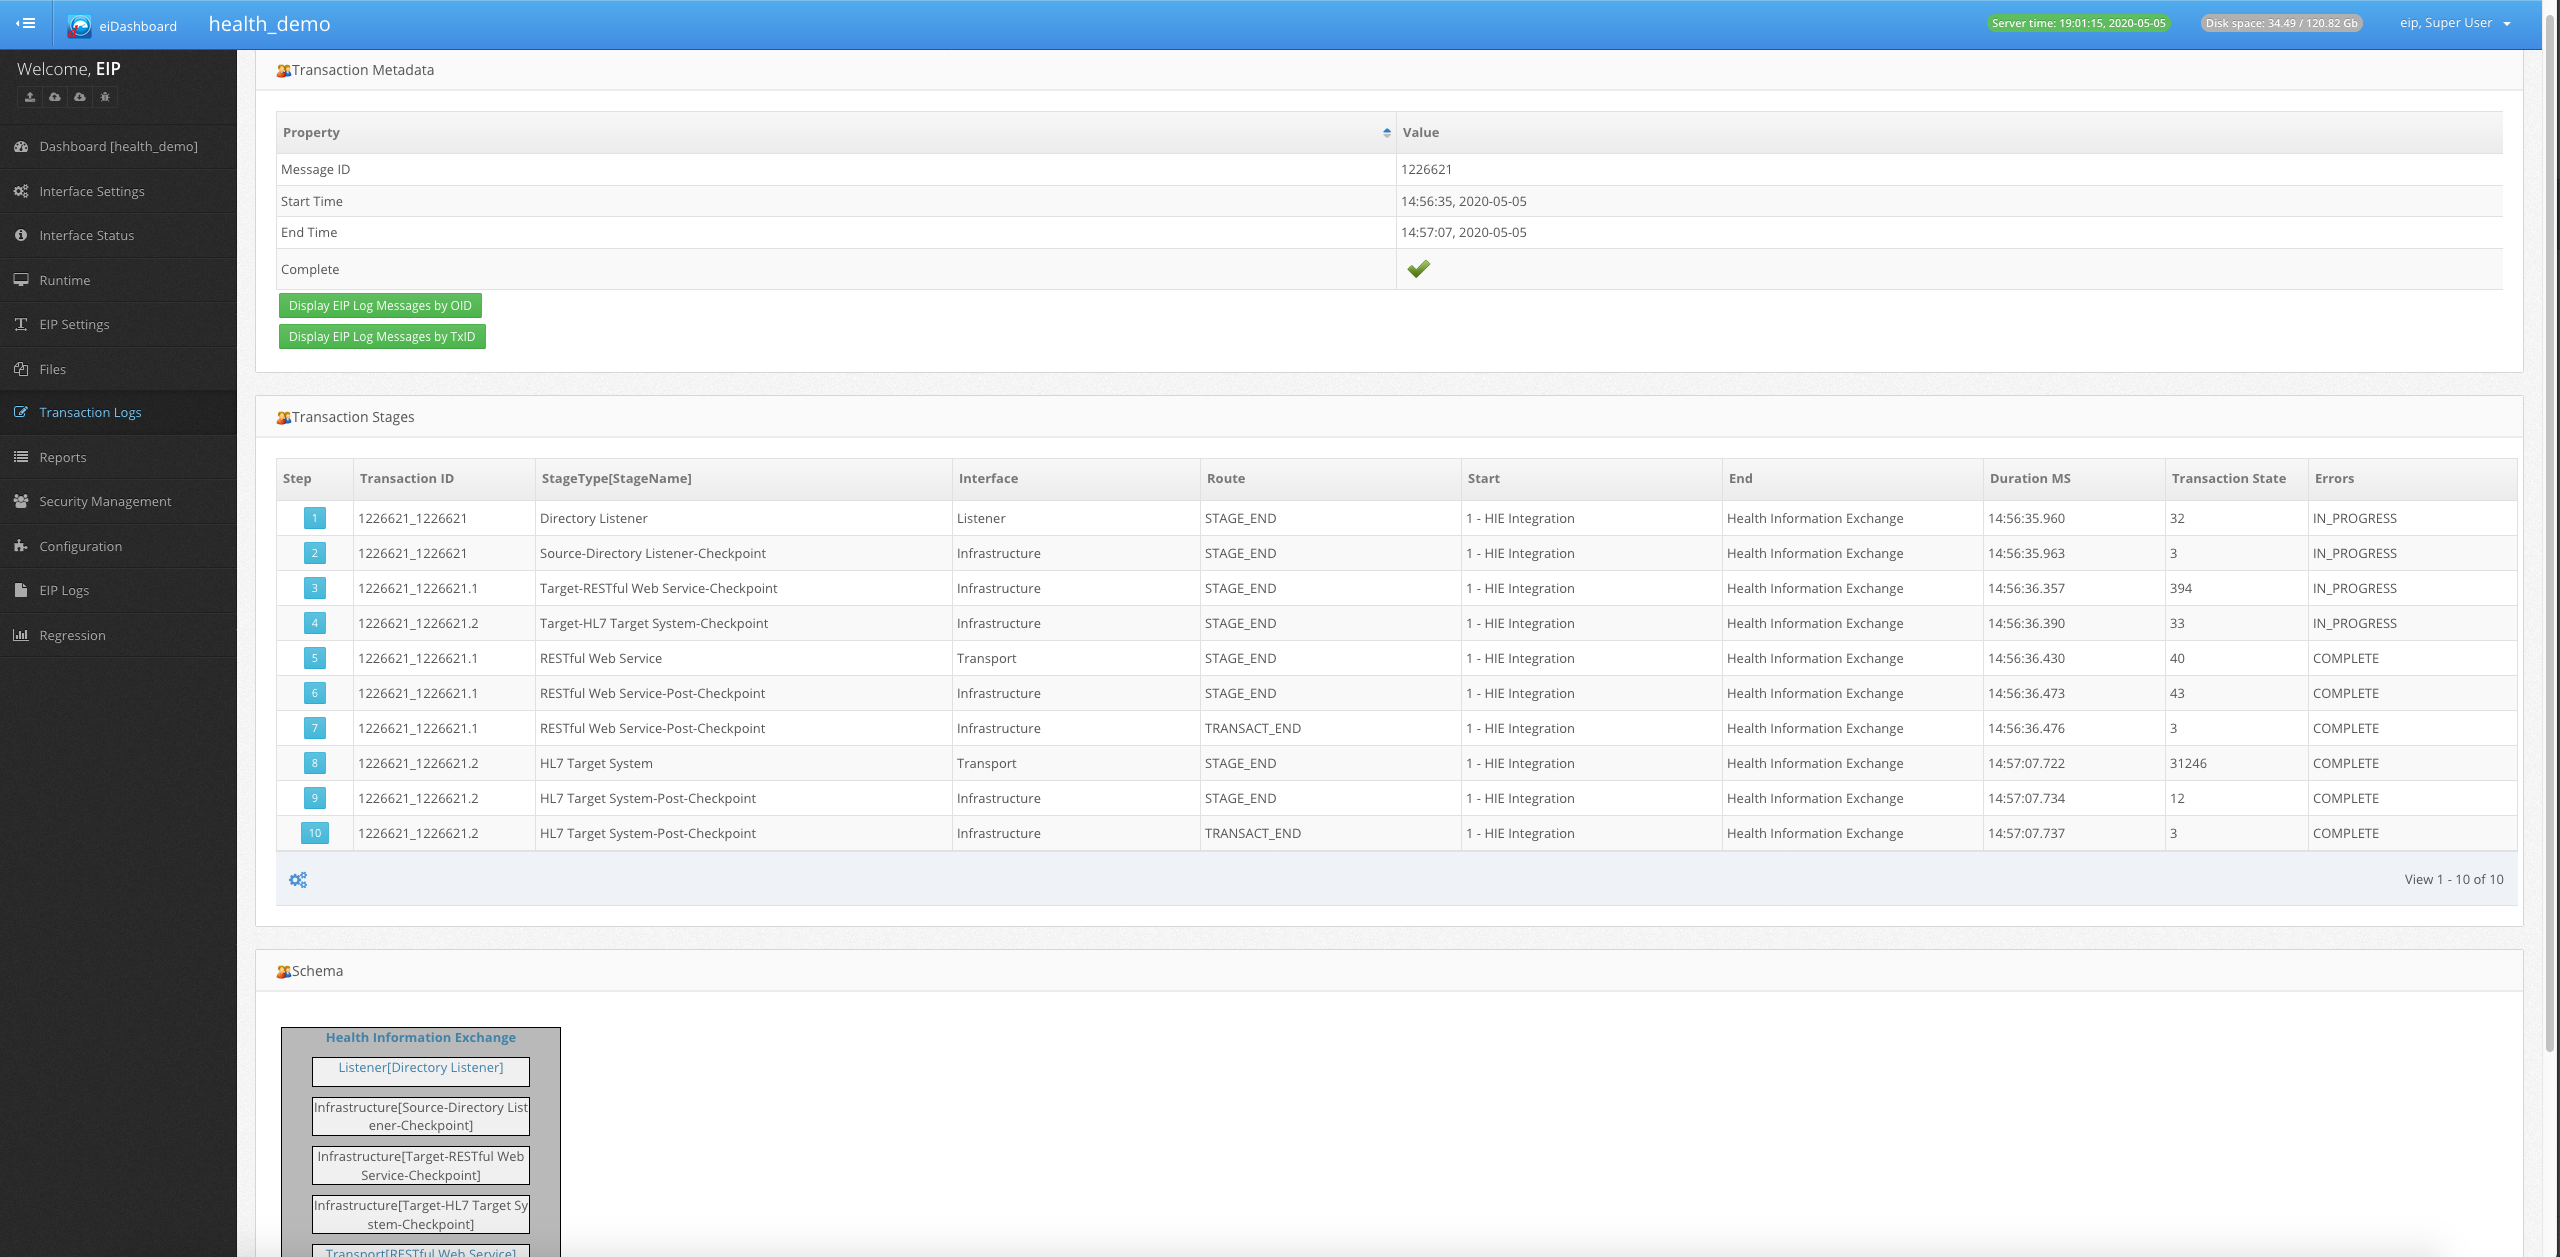
In this view, you can see which stages a transaction flowed through and when. In this particular case, the transaction forked into two sub-transactions which can be noted by the TransactionID appended by “.1” and “.2”. At the bottom, you can see a generic flow generated by the transaction. If you click on the blue step button on the left-hand side of the table you can see granular information about the transaction at that stage.
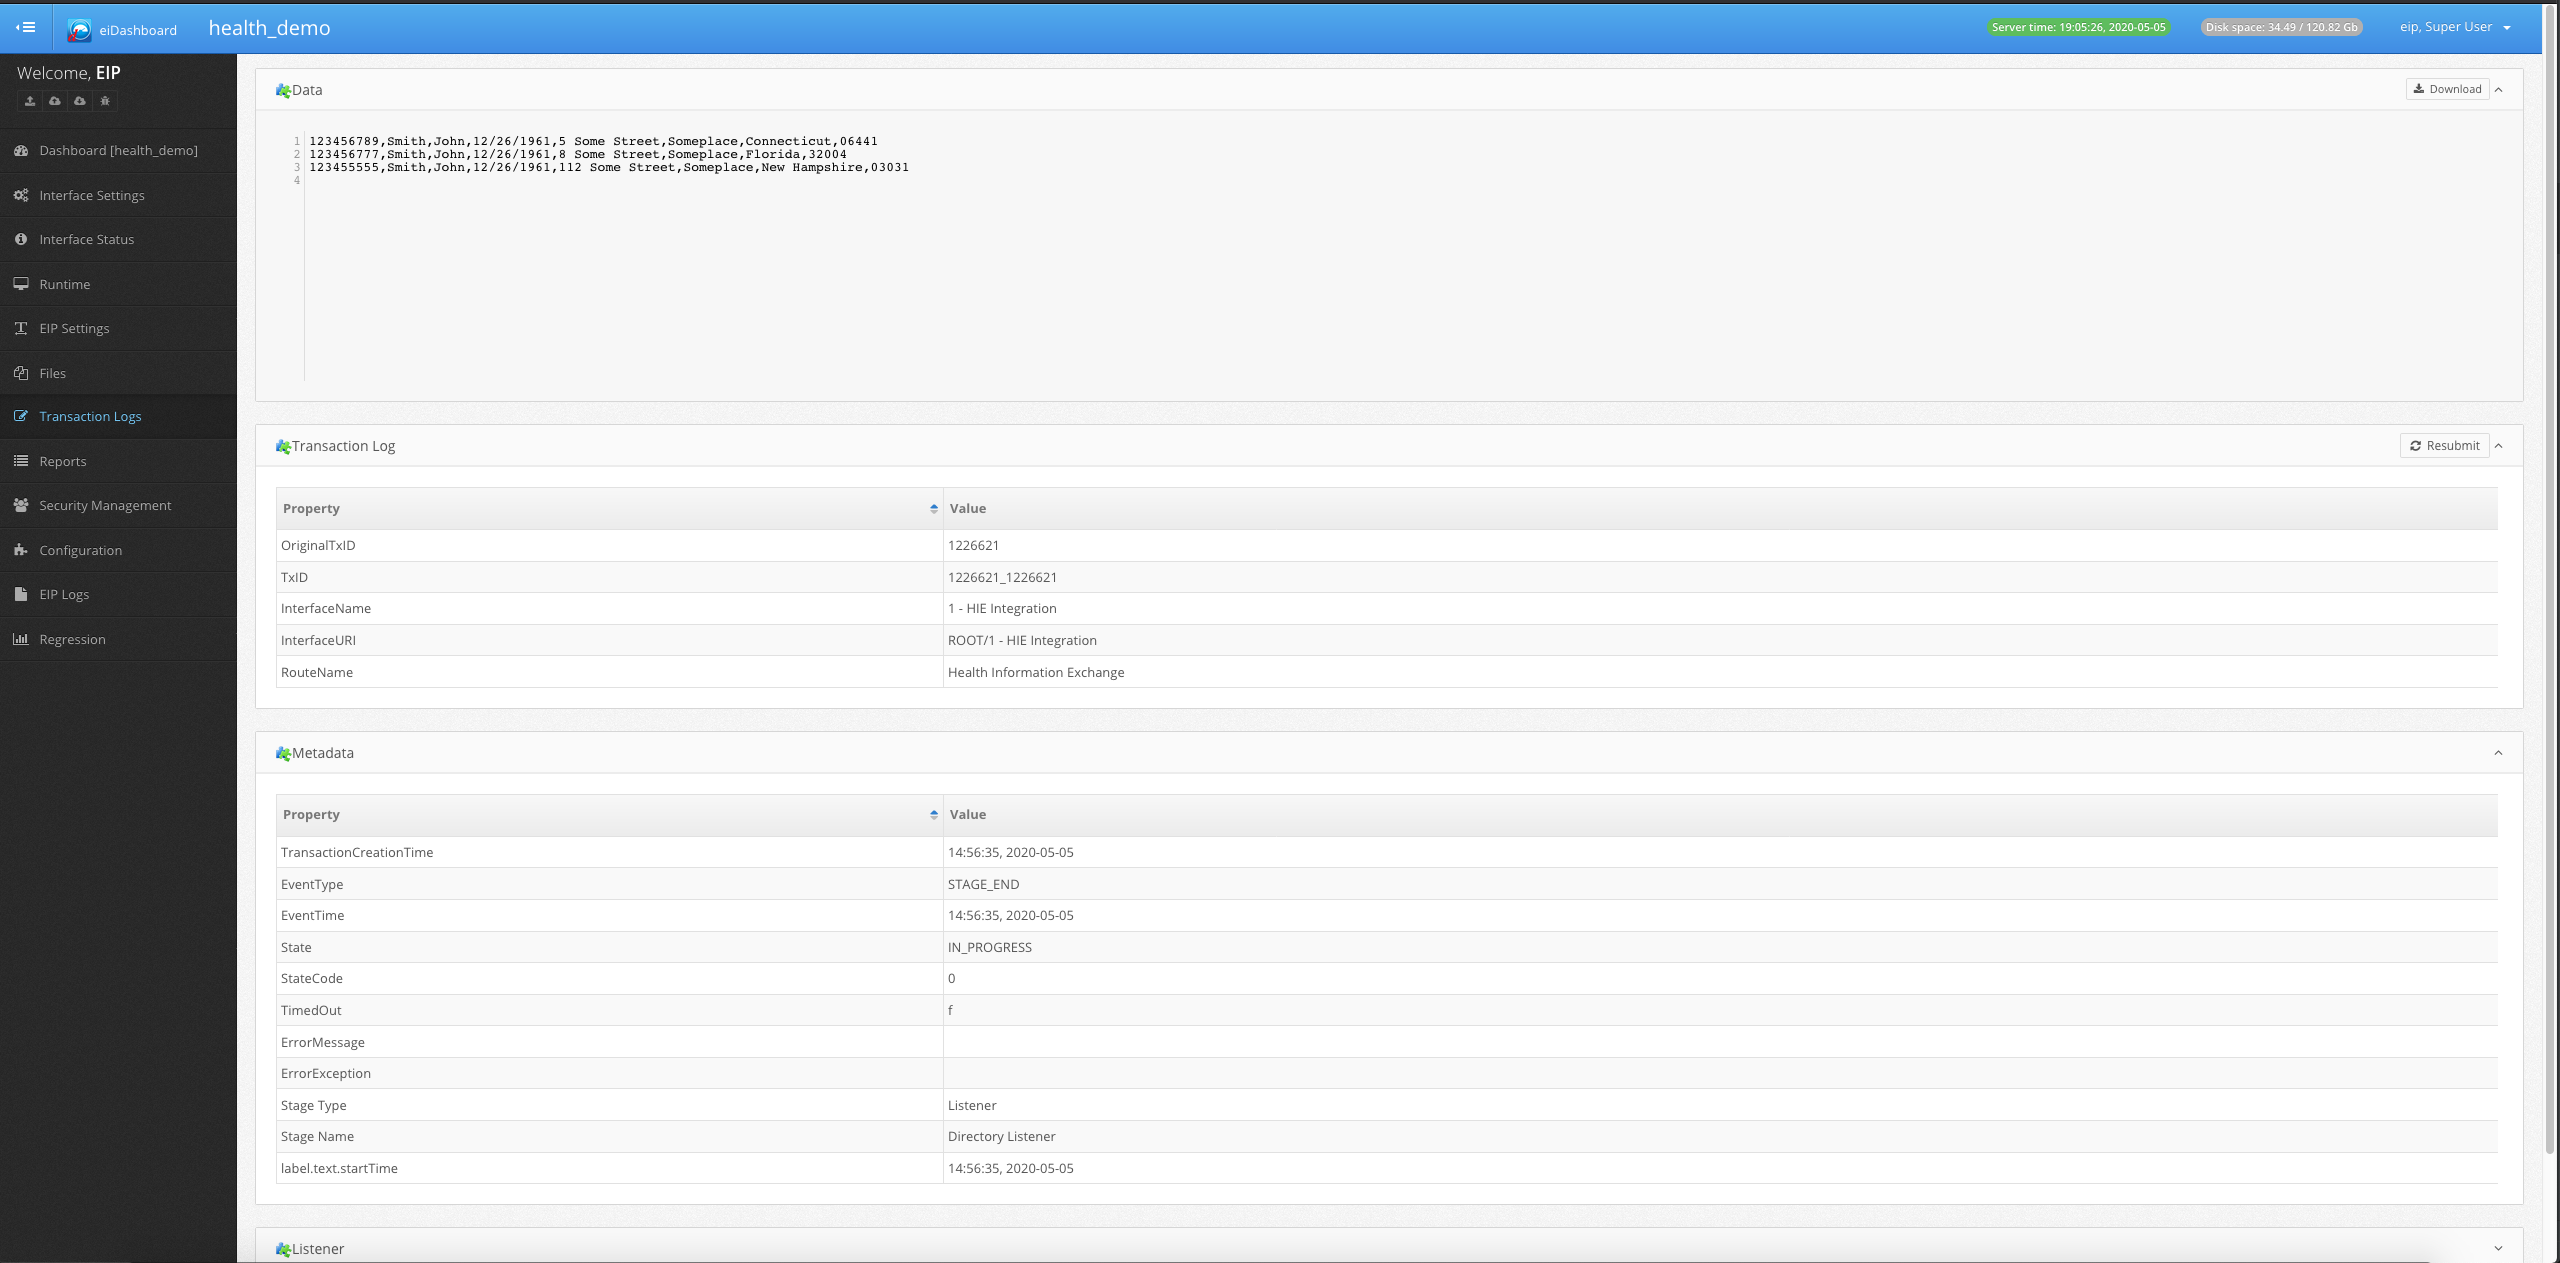
Here you can see the transaction data, some generic transaction log metadata and if attributes were enabled for logging, you could see them here as well.