EDI X12 Getting Started Tutorial
Welcome to the EDI X12 Getting Started Tutorial. In this tutorial, you’ll build a simple interface that accepts X12 EDI input and converts it into an Excel spreadsheet or XLSX file. This interface will take the average user 45-60 minutes to complete and will require the 3 sample files available for download below.
The General Quick Start Tutorial and Foundation Tutorials(Modules 1-13) are prerequisites before moving on to the EDI-specific tutorials and documentation. If you have not completed these, please do so now. The EDI X12 Getting Started Tutorial builds on concepts learned in the previous tutorials that are not repeated here and are required to complete this tutorial.
Note: This tutorial highlights enhanced EDI mapping and transformation functionalities requiring the X12 TR3 Table Data and Schemas. These are available from X12 and can be purchased individually by transaction set or as a bundle at the X12 Store. Click the link for more information on the enhanced functionalities of the eiConsole.
Working Directory
Before You Begin
Download the EDI-Getting-Started-Working-Directory.zip file with the sample Working Directory and unzip it on your computer to a convenient place. In our case, it’s c:\PilotFish\EDI X12\
Open the eiConsole and open a new working directory.
Route File Management Window
We begin on the Route File Management window. For this tutorial, we will be creating a workflow to take incoming EDI from the filesystem, transform that EDI into XML, and then select some fields from that EDI to create and populate an Excel spreadsheet. You will need the three sample files linked above, as well as the X12 TR3 Table Data and Schema for the EDI 837-Q1 transaction set (EDI 837 Professional Healthcare Claim).
Note: If you do not have access to the Table Data and Schema required for EDI Enhanced Functionality, you can still follow this tutorial and alter the mappings accordingly. However, we will use the EDI Enhanced Functionalities by default for this exercise.
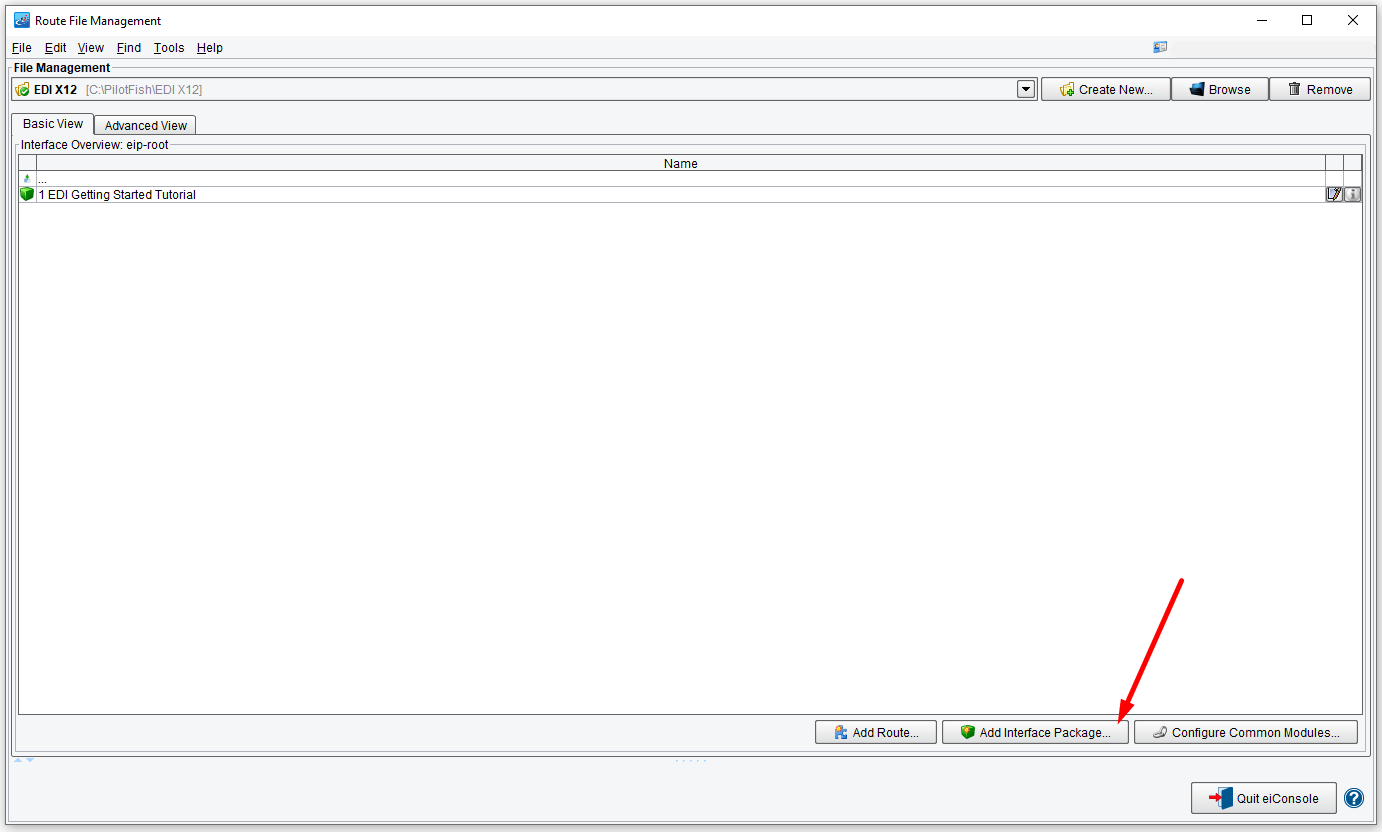
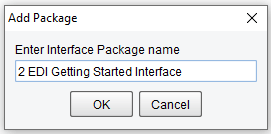
To begin, we will create a new interface package to hold the tutorial Route we’ll make. Interfaces are a great way to organize workflows and share configurations between integrations. Click the Add Interface Package button and supply a name for your interface in the dialog that appears. In our case, this is 2 EDI Getting Started Interface.
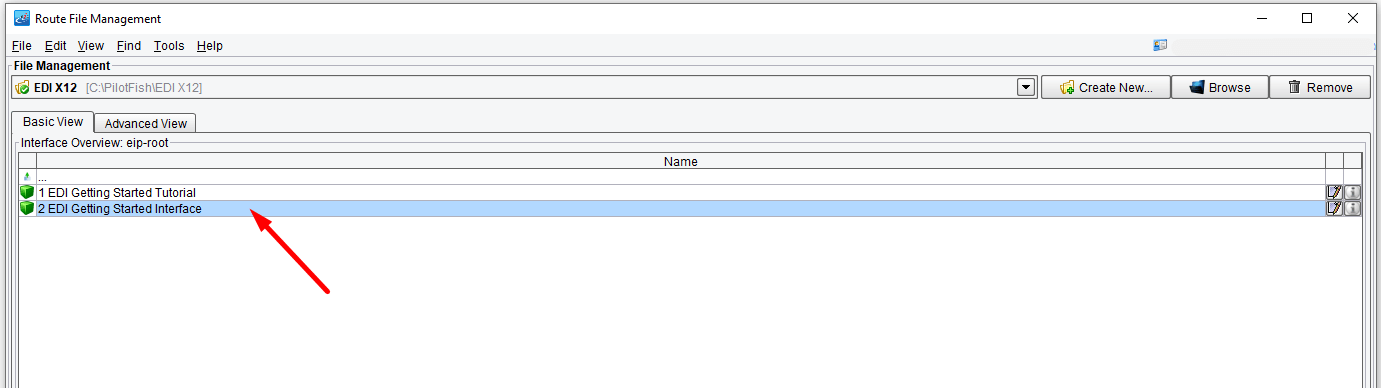
Double-click the interface that appears to enter it.
Next, we’ll create the Route for our integration. Interfaces can contain many Routes and can be nested within one another. Still, each Route is an individual transformation that follows the 7-stage assembly line process outlined in the General Tutorials.
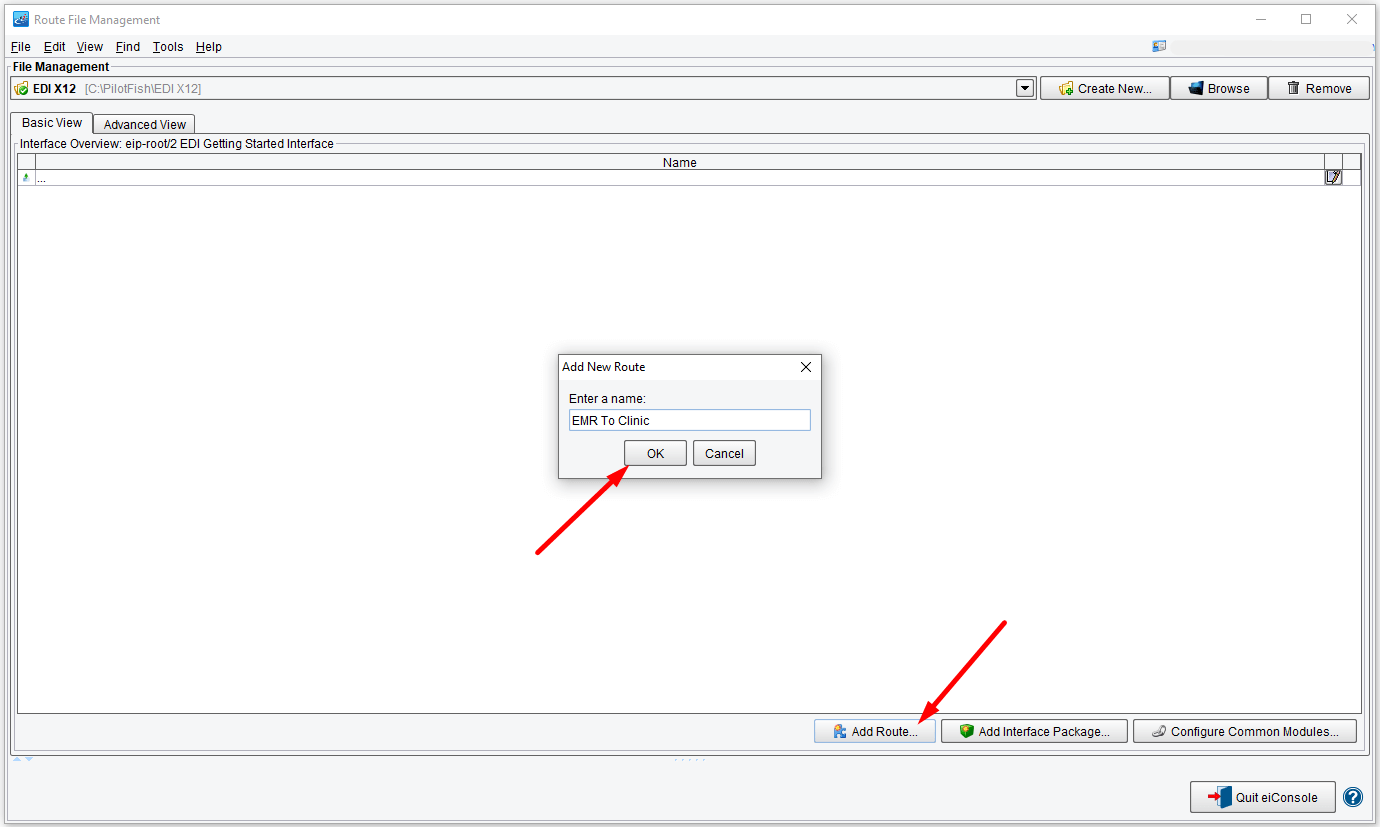
Click the ‘Add Route‘ button to create a new Route, and name it whatever you like (‘EMR To Clinic‘ in this example).
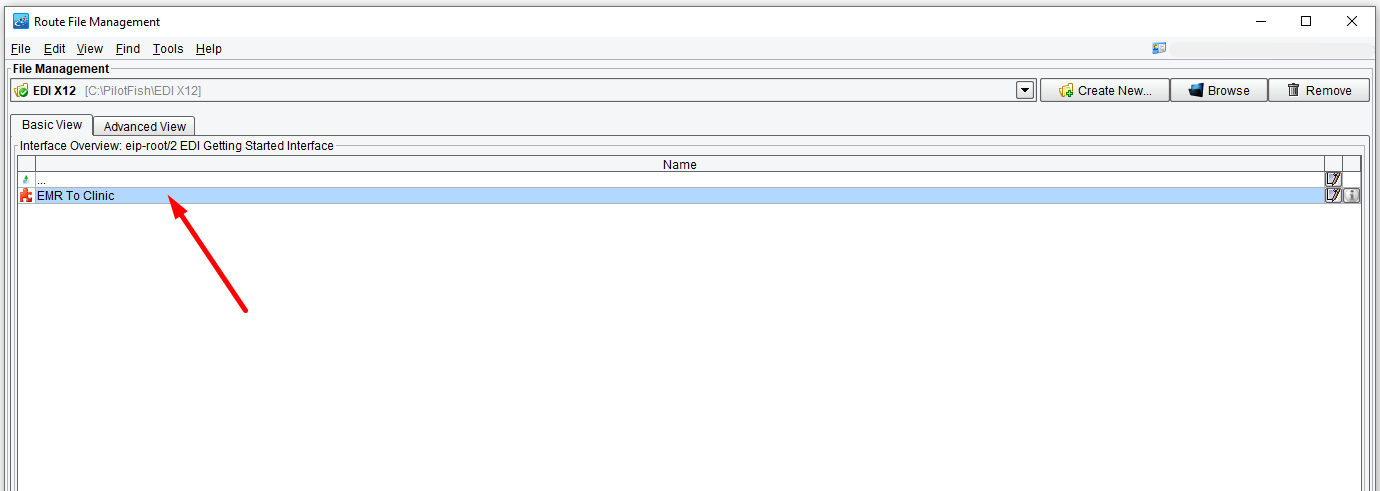
Our interface will now be populated with the Route we’ve made. Notice the red puzzle piece icon to the left of the name; this indicates that this Route is not yet correctly configured (since we just created it). Also, hovering the mouse anywhere over the Route name will show a tooltip explaining any configuration that is still required.
Double-click the created Route to enter the Route Grid.
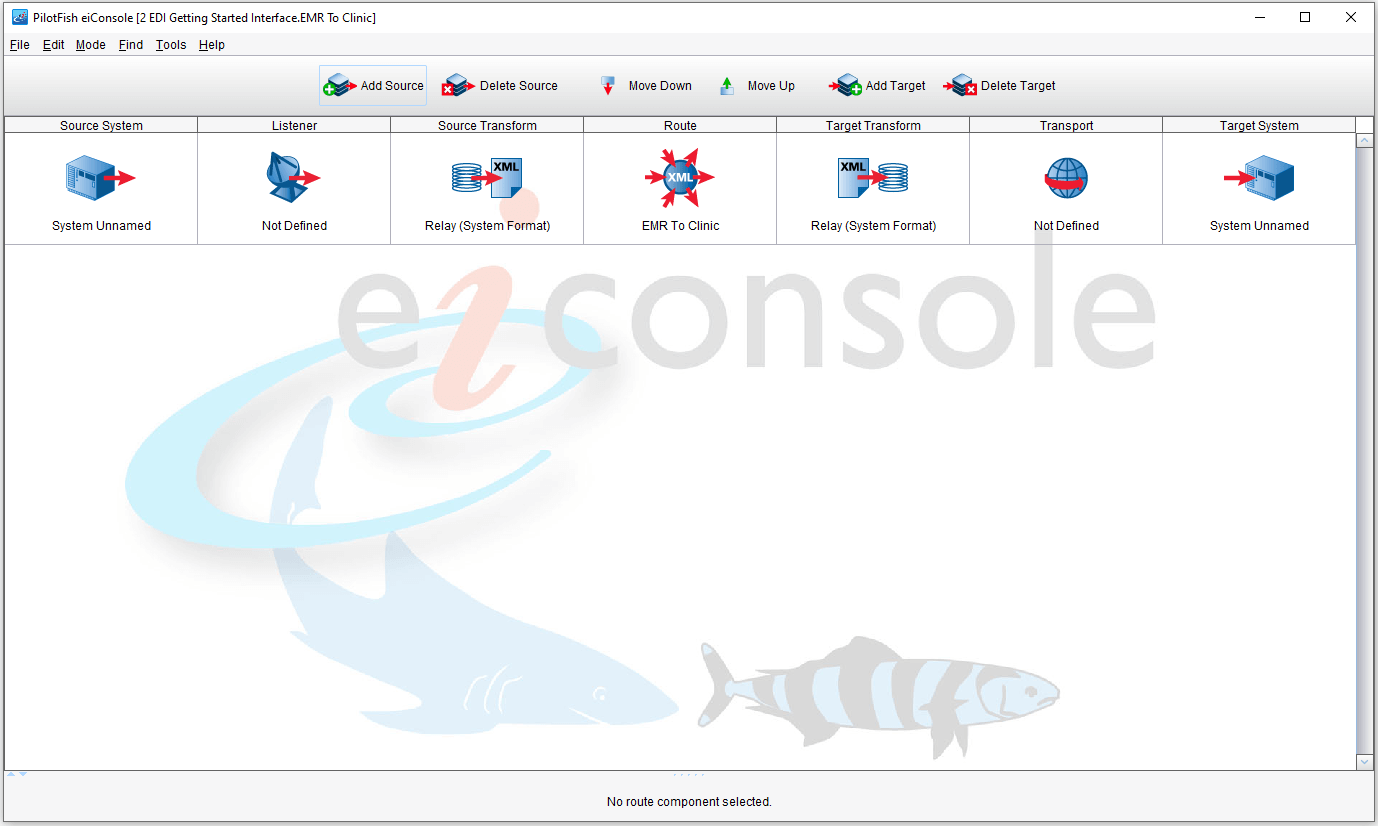
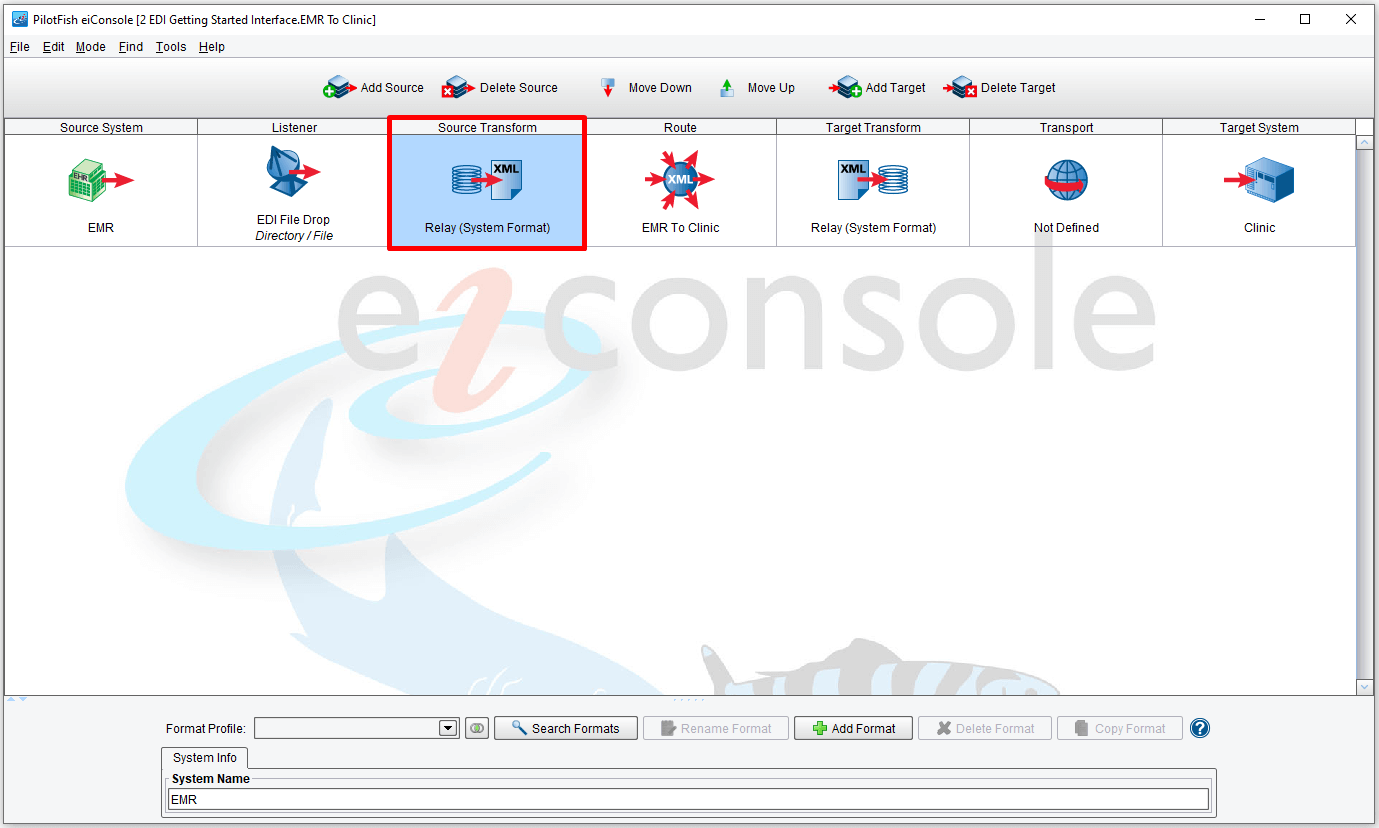
eiConsole’s Main Route Grid
The eiConsole’s Main Route Grid opens.
Adding Source and Target Names
The first step in configuring our Route will be to name the Source and Target Systems and give them personalized icons. Although this stage doesn’t directly affect the transformation process or data, it is beneficial when Routes contain multiple Source and Target Systems.
Click the Source System stage from the grid. Type a descriptive name into the Source System textbox (use EMR) and click the Choose Source Icon button.
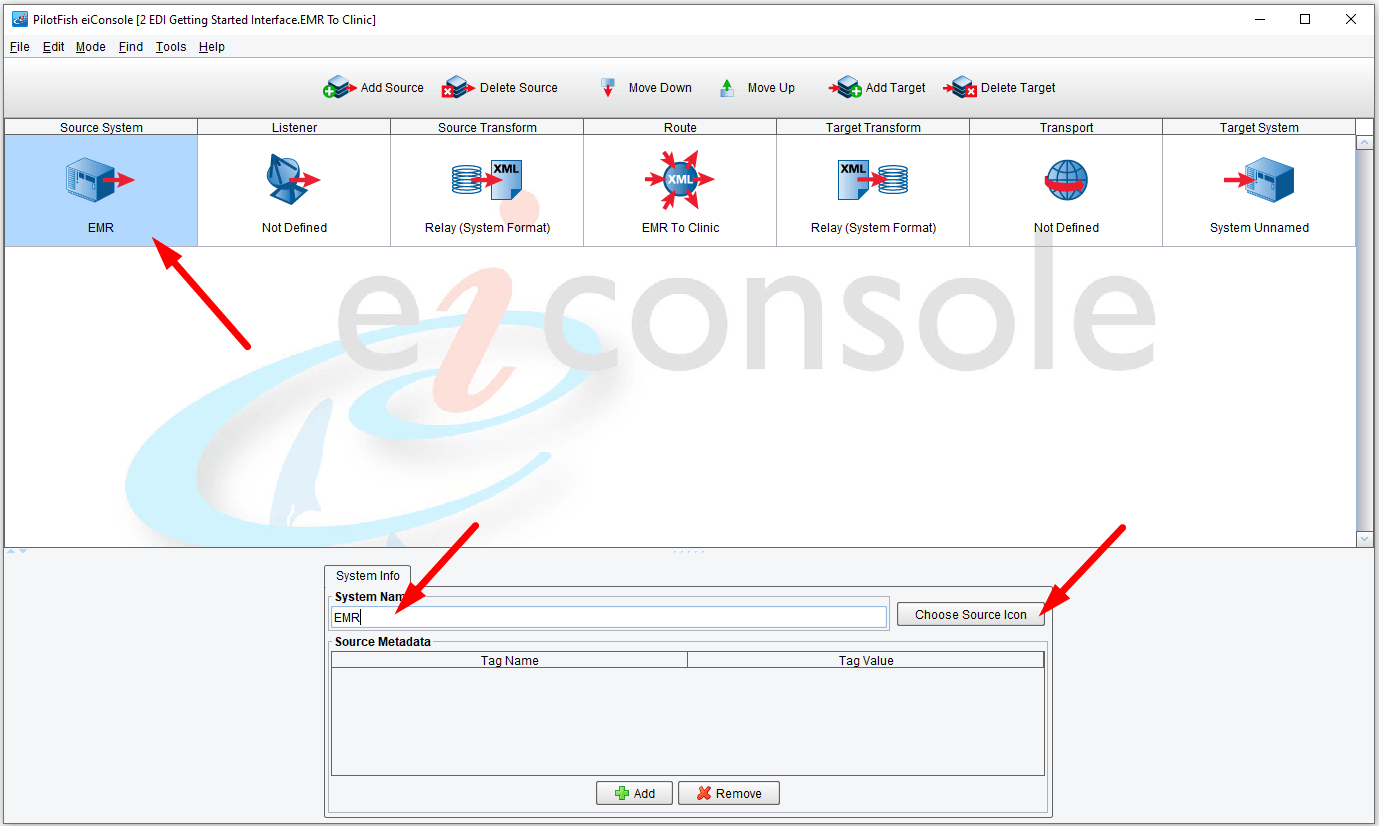
The icon dialog that appears will let you search and configure the icons available, as well as select color variants and upload your own icons. Choose whatever icon you’d like and click Select to return to the Route Grid.

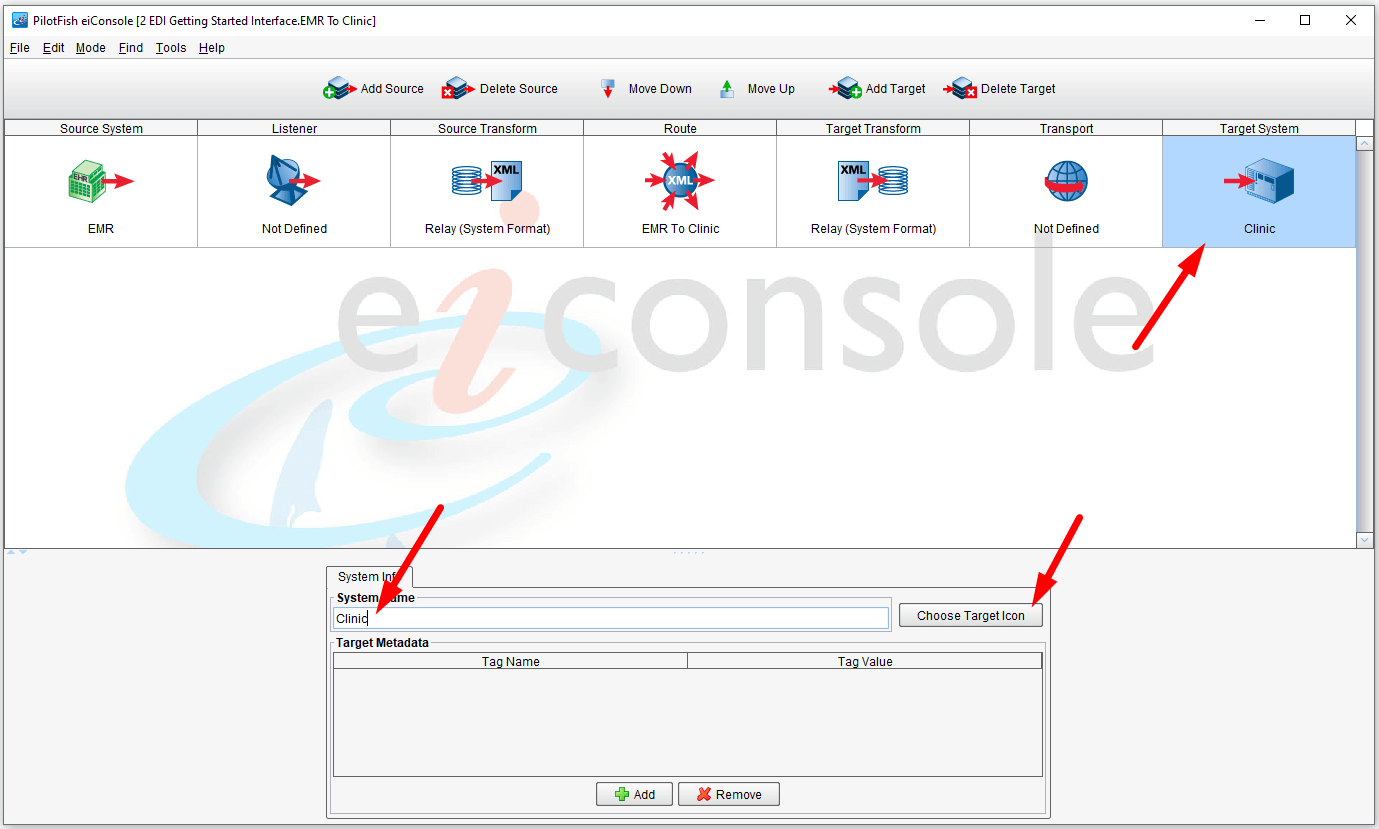
Next, we will add a name and icon for the Target System. Click on the Target System box in the grid and repeat the previous steps to define your Target System. Let’s name it Clinic.
Configuring the Listener Stage
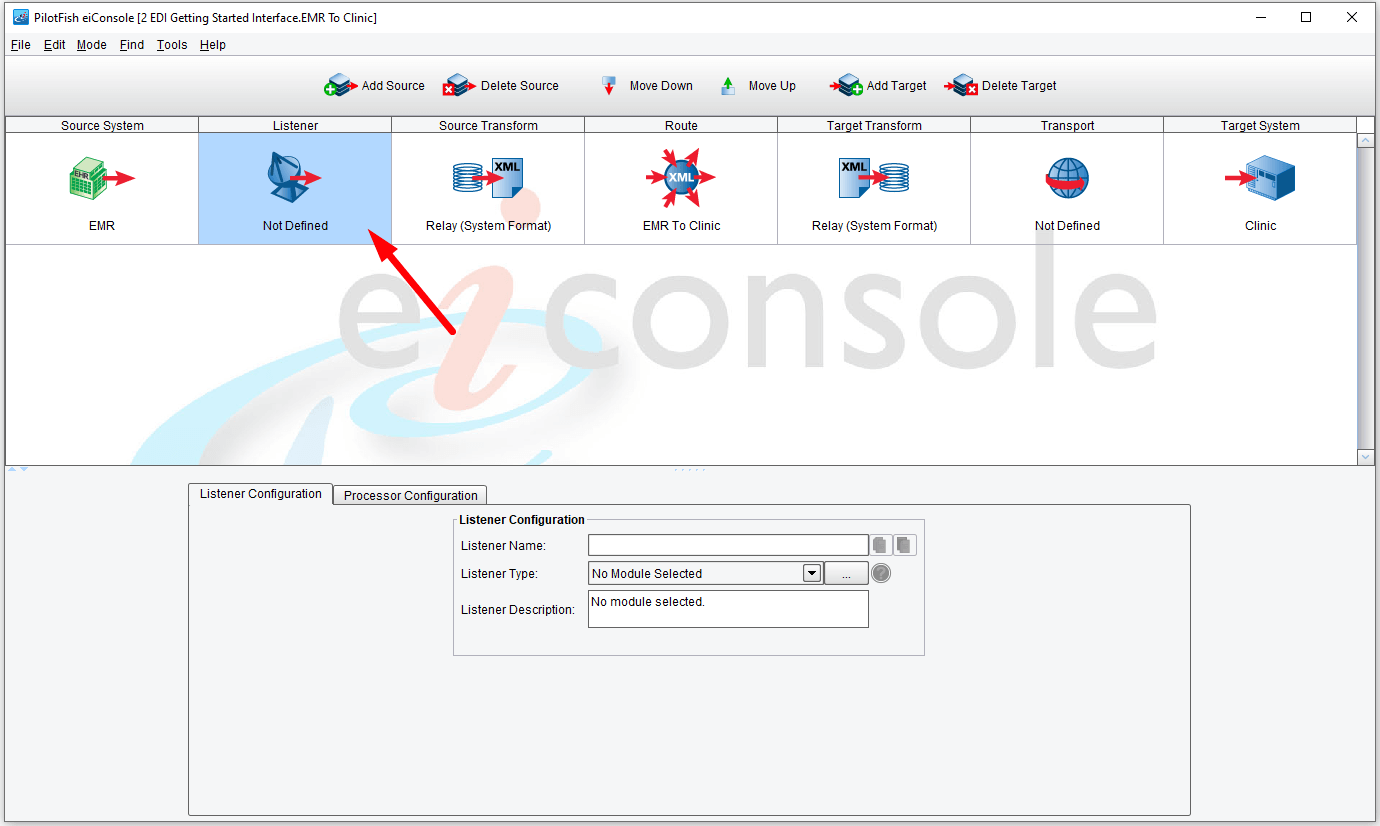
Next, we’ll configure the Listener stage. Begin by selecting the Listener stage from the Route Grid.
In this interface, our Source will be an EHR system producing lab results and sending them out to a Target System, which is assumed to be an external clinic or practice.
Click on the Listener stage and select the Listener Type from the drop-down. For simplicity, in this tutorial, we’ll go from Directory to Directory, but any number of Listener types are available (scroll through to review the list). They are all configured similarly; only the options change. Select the Directory / File Listener.
Note: When you click on any of the stages, specific configuration panels for that stage appear in the bottom half of the window.

The Listener Configuration panel for the Directory Listener opens at the bottom of the window. The red dots indicate the required fields. We’ll need to provide the Listener with a name and fill in the other configuration requirements.
Note: When you select a Listener Type, the eiConsole pre-fills in the Listener Name by default. However, we’ll want to change it to something more specific to our interface.
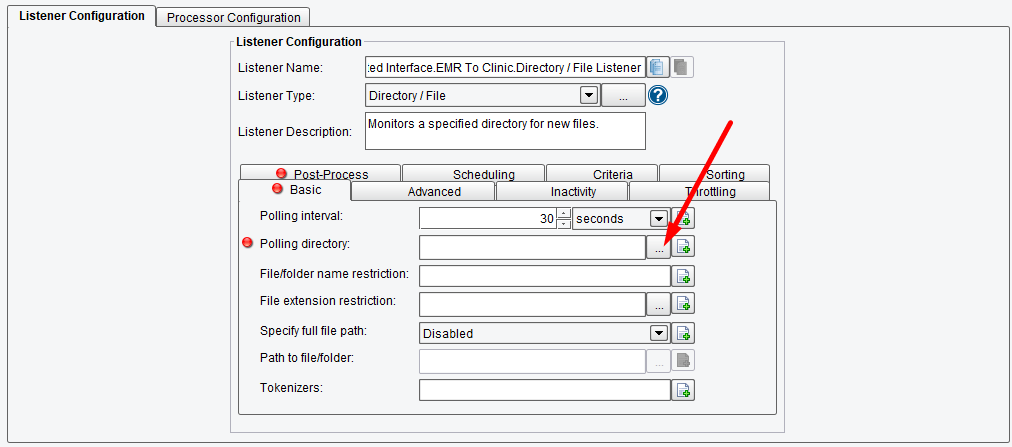
First, we’ll select our polling directory. Click the ellipses to open the list of files in the directory.
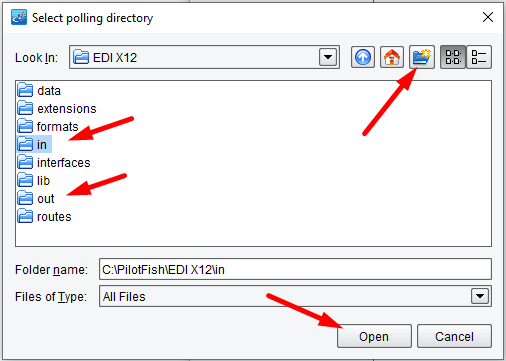
From this dialog, navigate to the desired input directory. Make sure it is somewhere the eiConsole can properly access and that the sample input files are available there. In our case, it’s c:\PilotFish\EDI X12. Create in and out directories. Select ‘Open‘ to confirm your selection.
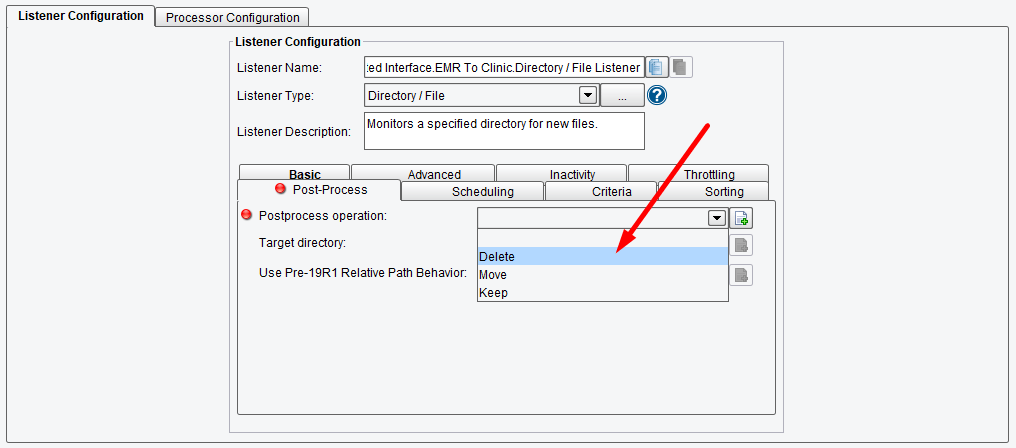
Next, we’ll set the Post-Process operation.
Note: As you fill in the configuration items marked with the red dots, they will disappear, indicating that all the required fields have been filled out.

Finally, we’ll give the Listener a more meaningful name. Click on the Listener Name field and assign a more descriptive name, in this case, EDI File Drop.
With the Listener stage configured, we’ll move on to the next stage, the Source Transform.
Configuring the Source Transform Stage
Next, click the Source Transform stage.
Here we’ll want to add a Format or Data Transformation that will convert an incoming EDI message to XML. Click the Add Format button.
In the dialog that appears, give the format a descriptive name. In our case, EDI-to-XML. Making format names specific and descriptive significantly improves their ease of reuse across workflows.

The Transformation Configuration panel will appear, including both the Transformation Module and XSLT configuration. Transformation Modules are used to parse data from non-XML formats into an XML representation. Whereas XSLT, and the eiConsole’s Data Mapper, are used for logically mapping one format to another.
In the Transformation Module drop-down, choose the EDI transformer. This indicates that we expect EDI input that we’ll parse it into XML.
Once we have selected the EDI Transformer, a new configuration panel appears, showing the available configuration options for our transformation.
Since we have the X12 Table Data required for our EDI 837 transaction, make sure the Use X12 Table Data for Enhanced Functionality option is checked and the Use Bundled x12 Table Data option is also checked.
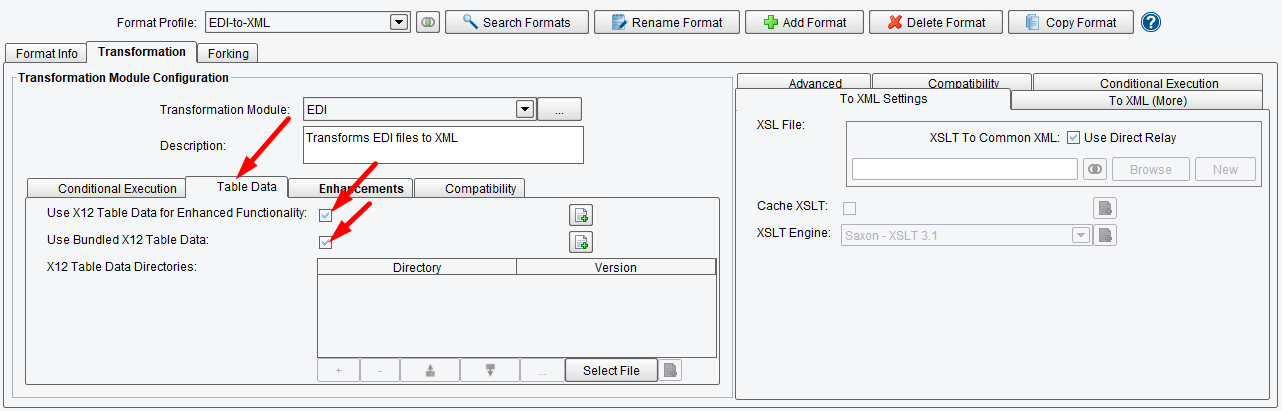
Note: During the trial period, we include the X12 table data automatically when you check the Use Bundled X12 Table Data option. This tutorial will work without specifying the X12 Table Data Directories. After the trial period, you will need to include the appropriate data directories.
**The next 2 screens and instructions are only to be used after the trial period is over. **
Click the Select File to select the directory where the Table Data is located.
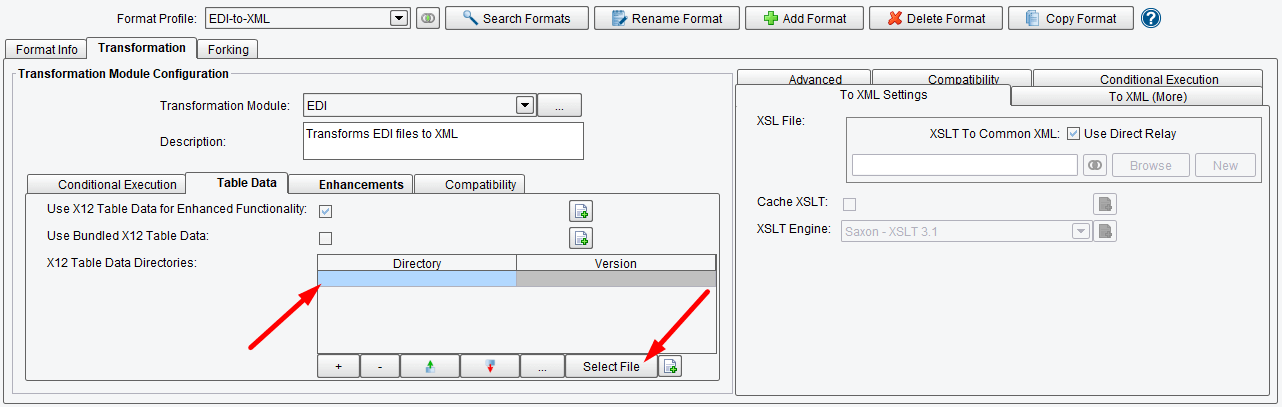
Note: The TR3 Table Data is divided up by Transaction Set (EDI 834, EDI 837-P, EDI 270, etc.), so you may have several different directories with Table Data in them. It is important that the directory selected matches the transaction set you are trying to process.
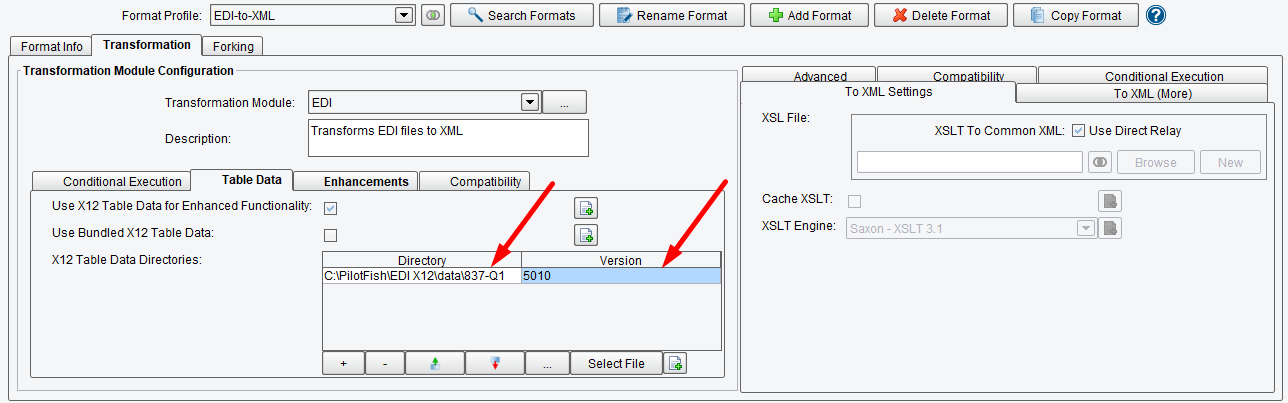
We also have to specify the version of the X12 Table Data.
In this case, it would show C:\PilotFish\EDI X12\data\837-Q1
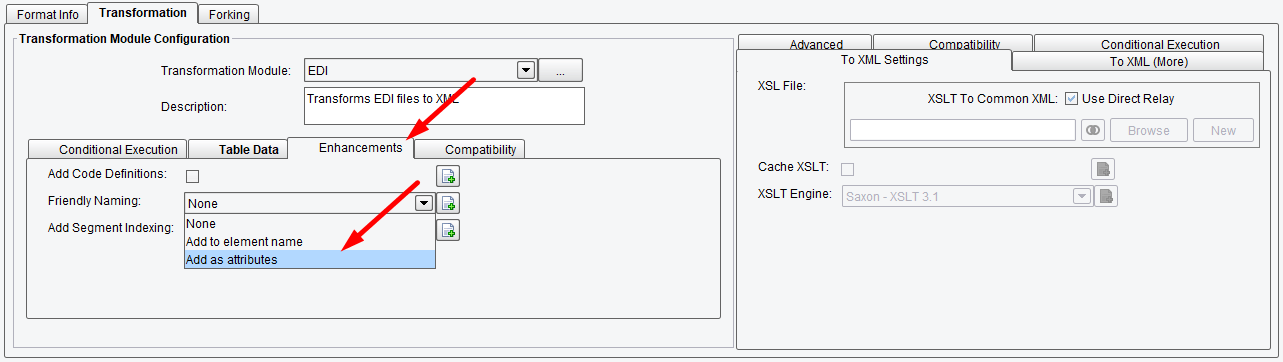
On the Enhancement tab, we can also add code definitions and friendly element naming if we like. Select the Add as attributes option from the Friendly Naming drop-down to give our EDI output more easily readable contextual information.
At this point, our EDI Transformer is properly configured. Since we don’t need to perform any logical mapping, we’ll leave the right-hand panel as it is and move on to the Routing Stage.
Configuring the Route Stage
Next, click the Route stage. Once again, you’ll see a configuration panel open in the bottom half of the screen.
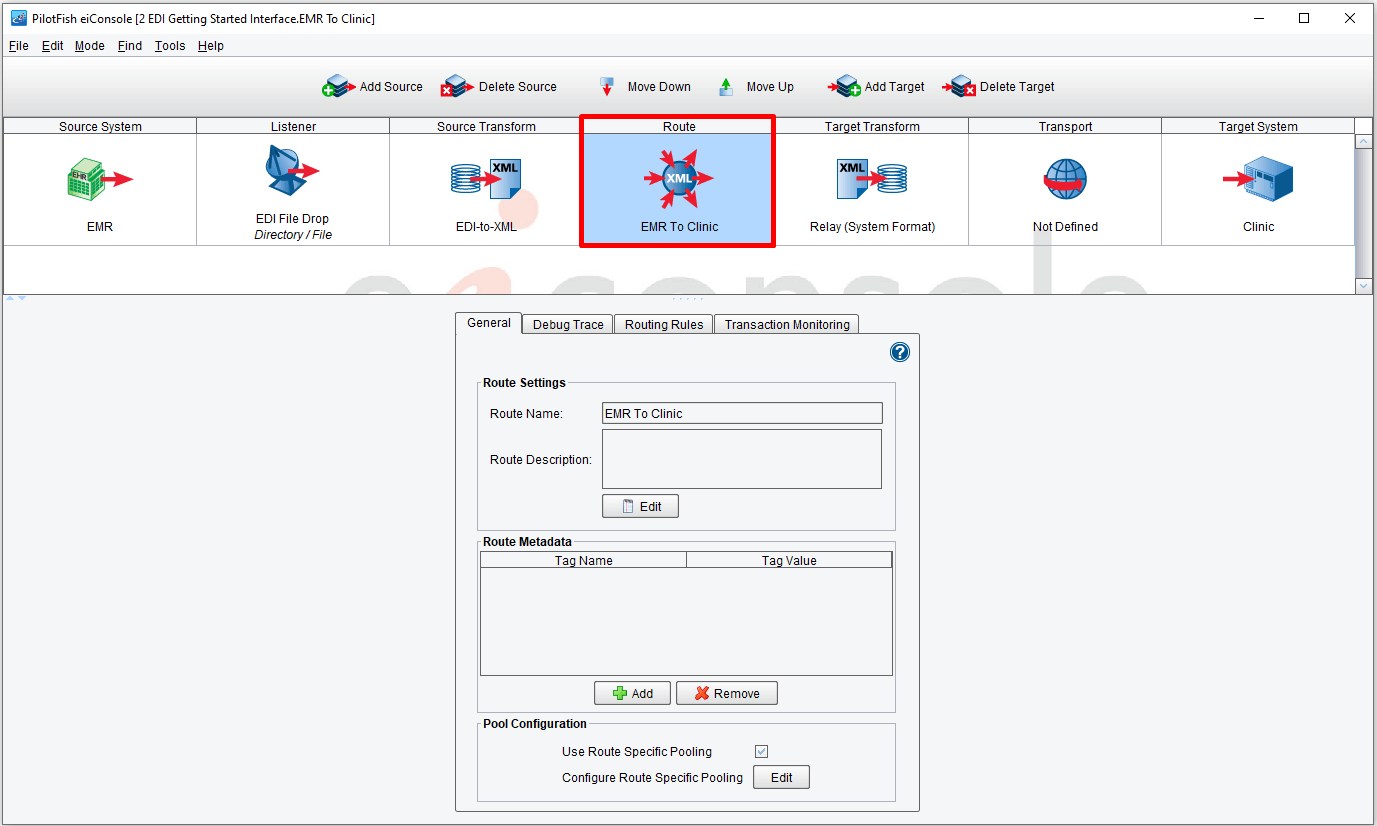
Then select the Routing Rules tab. Click the drop-down. The Routing Module lets you select from All Targets and XPath / Attribute. But in our example, we have only one Target system, and we can leave the default setting of All Targets selected.

Configuring the Target Transform Stage
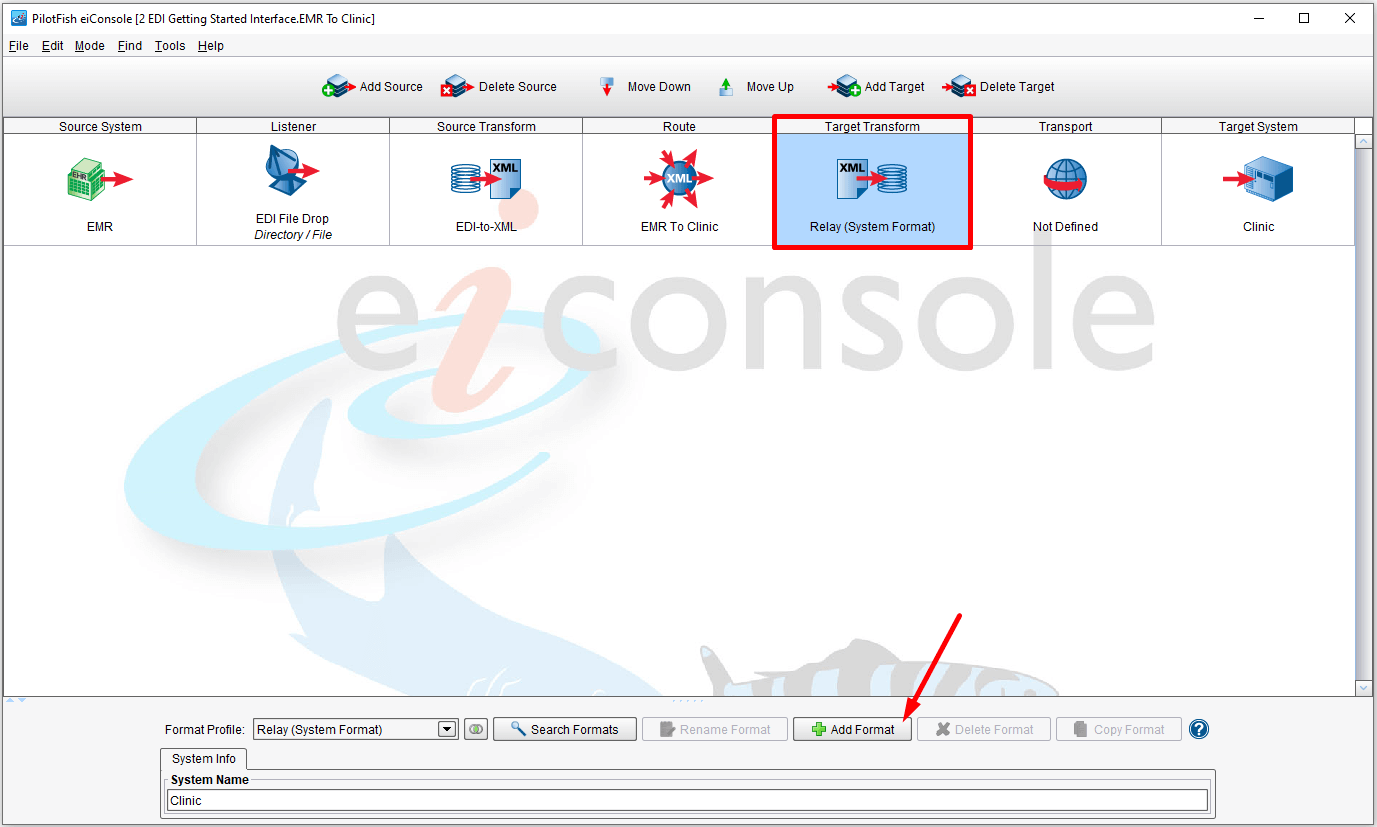
Select the Target Transform stage. Here we’ll want to map our new XML representation of EDI onto an Excel spreadsheet. Click the Add Format button.
In the Add New Format dialog, enter XML-to-XLSX and click OK.

First, we’ll define our Target Transformation Module on the right-hand side of the panel that appears. Click the Transformation Module drop-down and choose the Microsoft Excel option since that is our desired output format.

The Excel Transformer doesn’t require a lot of configuration, but we still must select the Excel version to output. Select 2007 from the Excel File Format drop-down to create Excel that is compatible with newer versions of MS Office.

Lastly, we’ll want to add column headers to our outgoing Excel. This is done by making sure the Add Header option is checked.

Now that our Transformation Module is configured, we’ll define the logical mapping that will convert our EDI XML to an XML format representing an Excel worksheet. For this task, we will use the Data Mapper.

To get started, unselect the Use Direct Relay option and click the New button.
Configuring the Data Mapper
This launches the eiConsole’s Data Mapper. The Data Mapper is where we perform the logical mapping between any two data formats. It has 3 panels, a panel on the left for the Source format, a panel on the right for the Target format and a panel in the middle which will contain the logical mapping between the two. To start, we’ll need to load our Source format and Target format, and then create the relationships between the two.
First, we’ll load the metadata for our Source and Target. To do this, click the Open source format icon.

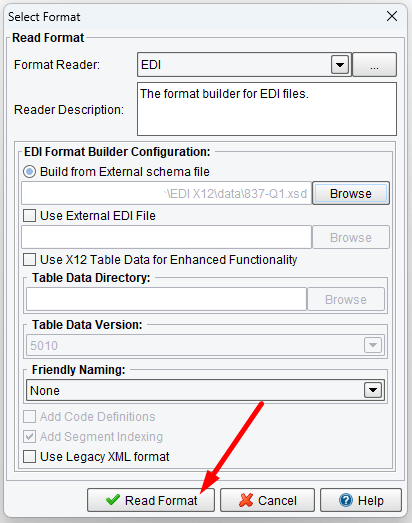
From the Format Reader drop-down that appears, select EDI.

Click Browse.
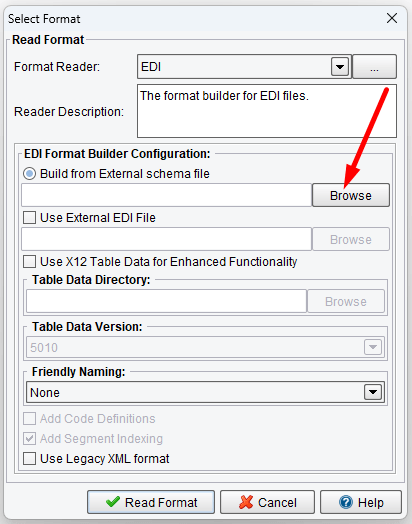
In the file selection dialog that appears, select the proper schema for the X12 EDI transaction set you’d like to map with. In this case, we’re using the EDI 837-Professional, so select the 837-Q1.xsd and click Open. The file can be found in c:\pilotfish\EDI X12\data.

Now that the Format Reader is successfully configured, click Read Format to build the Source Format in the Data Mapper.
Our Source Format is now correctly loaded.

Now we’ll start the same process on the Target Format side by clicking the Open Target Format button.

Since our desired XML output will be used to generate an Excel spreadsheet, select Microsoft Excel from the Format Reader drop-down.

To assist in building our Format, the Excel Format Builder takes in a supplied XLSX file and uses that file to pre-populate some Format fields for us. Select Browse to open a file selection dialog.

Select the Excel sample file downloaded earlier and click Open.

Lastly, click Read Format.

Now that both our Source and Target formats are loaded properly, it’s a good point to save our progress. Select the disk icon shown to save our mapping.

Enter XML-to-XLSX in the dialog that appears and click OK. This will save our mapping for future use.

At this point, we are ready to begin mapping. The basics of using the Data Mapper are covered in both the Getting Started Tutorial and General Tutorials. For this tutorial, the Data Mapper will use the target sample data to provide a good starting point. Select the Add Target Sample Data as Template option from the toolbar highlighted below.
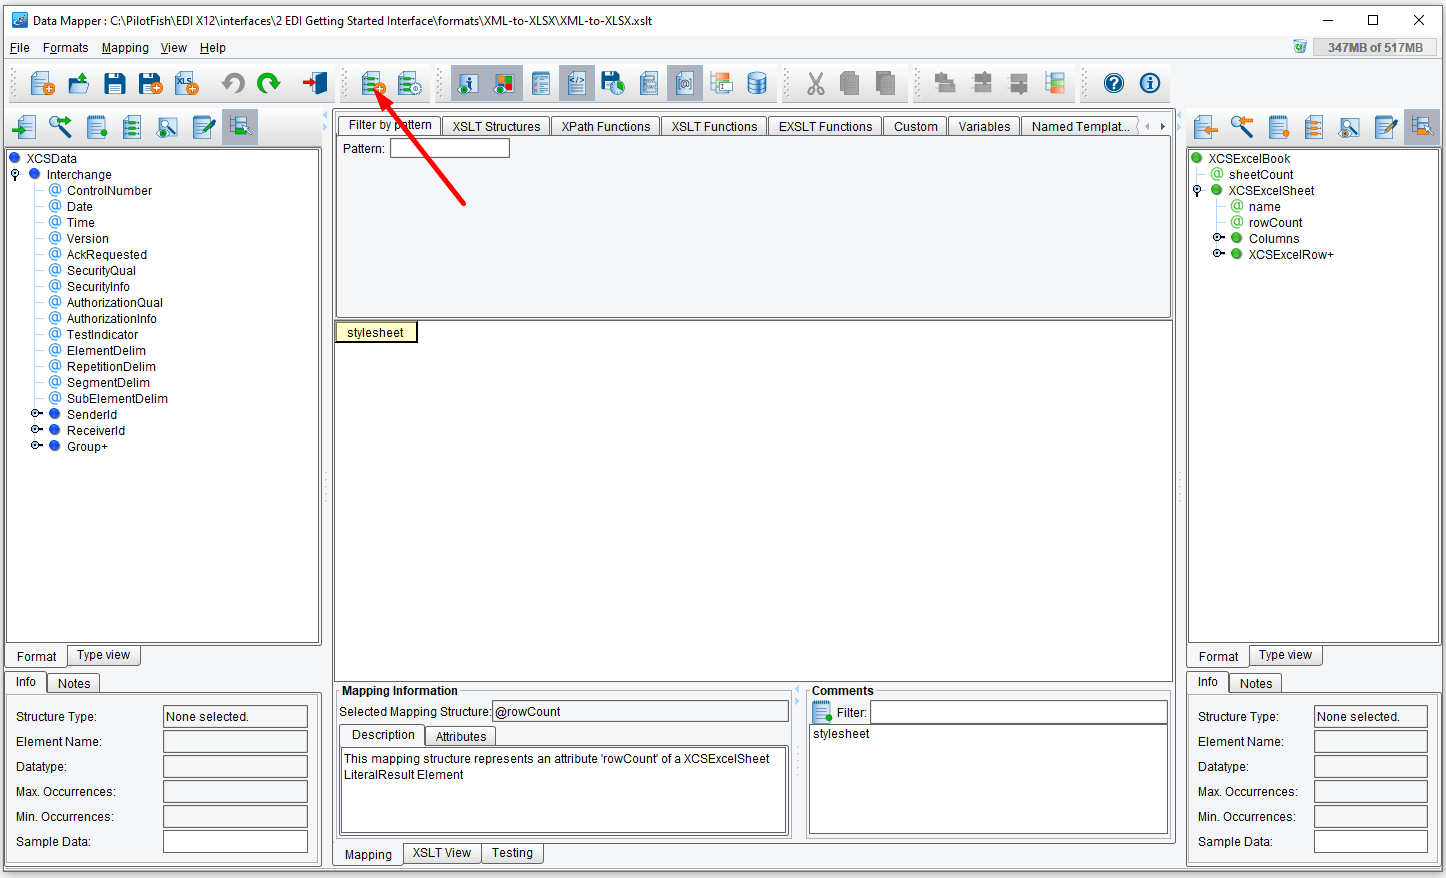
Select ‘Yes‘, and the Data Mapper will use the sample Excel sheet we provided to build a basic output mapping that we can then expand upon.

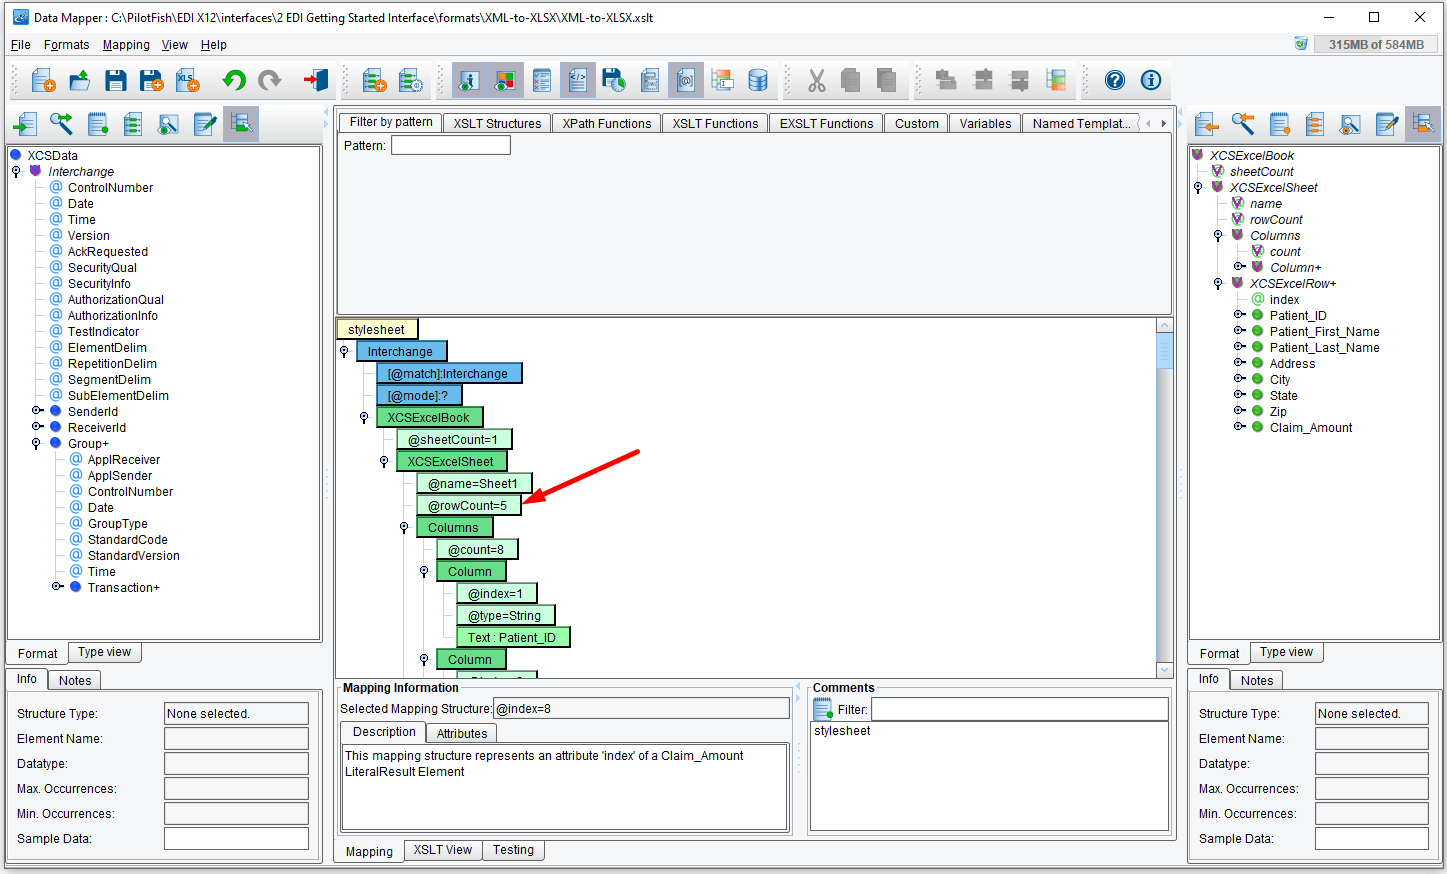
You will see the center panel populated with a number of green nodes representing elements from our Target format, and notice also those nodes are now checked in the Target Format tree.
As mentioned above, this is only a baseline and we will have to do some massaging to represent our desired output properly. The first fix we will make is to the @rowCount attribute, pointed out below. Since our incoming EDI could have any number of rows, not always 5, we’ll need to replace it with a more dynamic value using some XSLT functions.
To start, we’ll remove the old rowCount attribute completely. To do this, right-click on the @rowCount node and select Delete from the context menu.

Notice the entire node is gone from the mapping. Now we’ll replace it with an XSLT structure that we can populate with a dynamic value. To do this, right-click on the XCSExcelSheet node where we want the attribute to be and navigate through the context menus to the attribute option, shown below. The yellow sphere means it is an XSLT function.

Now that we’ve put the attribute node back into our mapping, we need to name it and give it the desired value. Type rowCount into the @name node that appears below in blue.

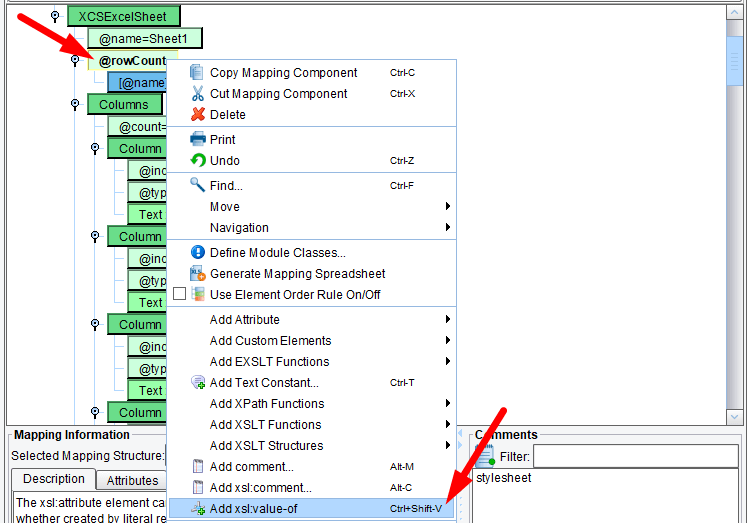
Next, we need to tell the attribute node what value to assign. Remember, we wanted to assign a more dynamic value so we’ll use the value-of function. This lets us define the function that will resolve to a final value when the mapping executes.
Right-click on the rowCount attribute node we just made and select the Add xsl:value-of option.
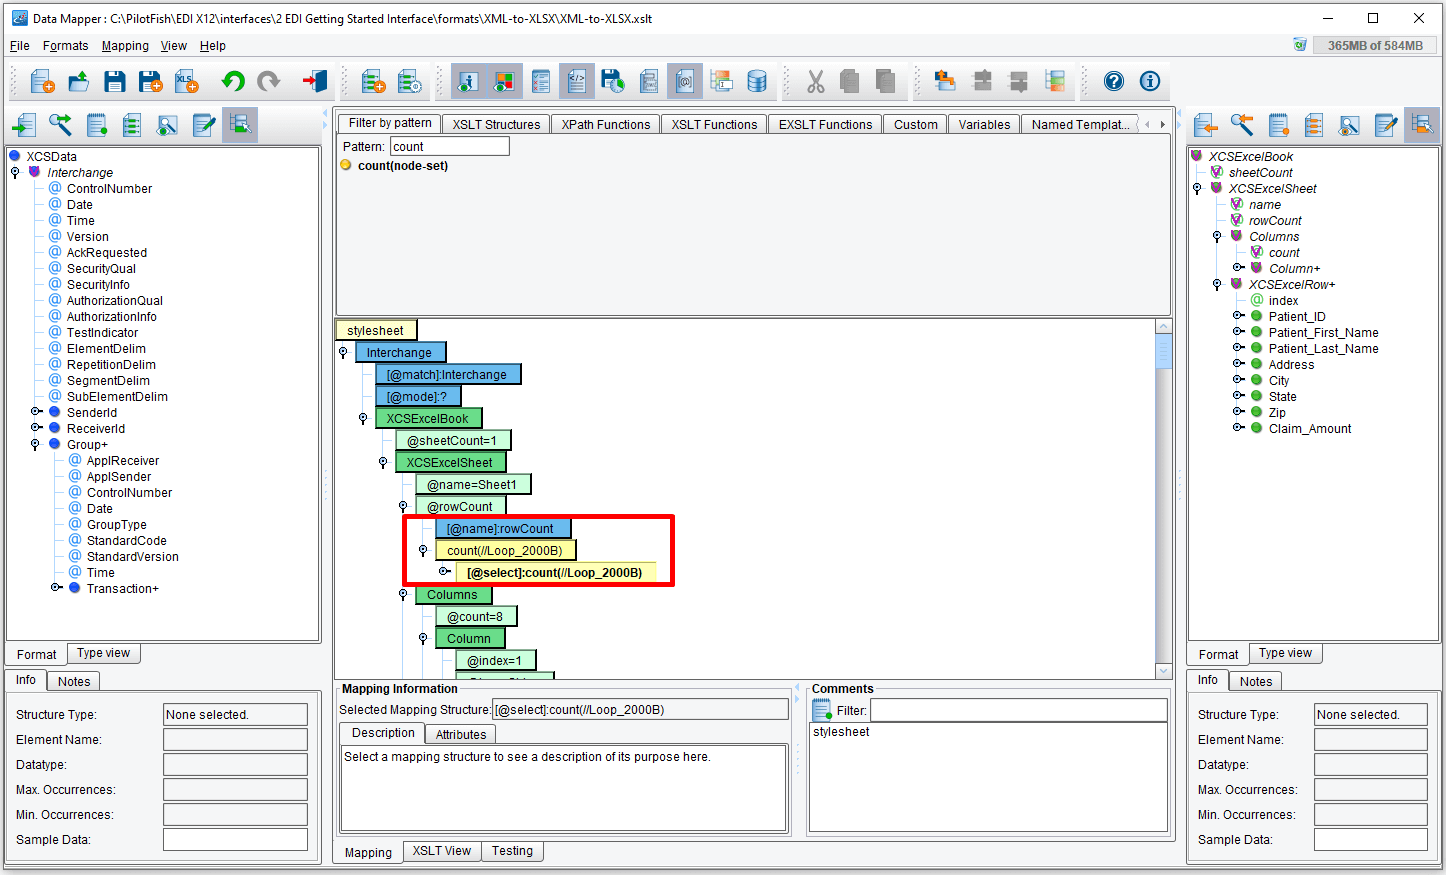
Now that we have all the nodes in the right place, it’s time to assign the dynamic value we want. In this case, we’d like to make a new row for each EDI 837 patient claim, so our dynamic value should be the total count of the Loop_2000 B’s. Find the count function in the Command Palette, shown below, and drag it into the [@select]: node.

Finally, fill the count() function that appears with the XPath representing the patient claims elements. The final result, shown below, should be count(//Loop_2000B).
Scroll back to the top of the mapping. Make sure your XCSExcelBook, XCSExcelSheet nodes are expanded and that you can see the XCSExcelRow element (you’ll want to be sure that the Columns element is NOT expanded). Select the Flow Control sub-tab underneath the XSLT Structures tab.
We’ll want to create an Excel row for each patient result in our EDI file (Transaction/Loop_2000B+).
To accomplish this, click and drag the yellow for-each node on top of the XCSExcelSheet element, but don’t release your mouse until you are almost at the bottom of the element.
TIP: You’ll see a gray bar and yellow highlight appear, which tells you when to release your mouse on the node.

The for-each node will appear at the bottom of your mapping. You’ll need to scroll down to view this.
Now scroll up and collapse the XCSExcelRow elements that were generated by our base mapping. This will allow you to see both the for-each and the XCSExcelRows.

Since we want to generate a row for each instance of a patient result, we’ll now drag the Loop_2000B+ element onto the select node of the for-each (watch for the yellow highlight) and then release the mouse.
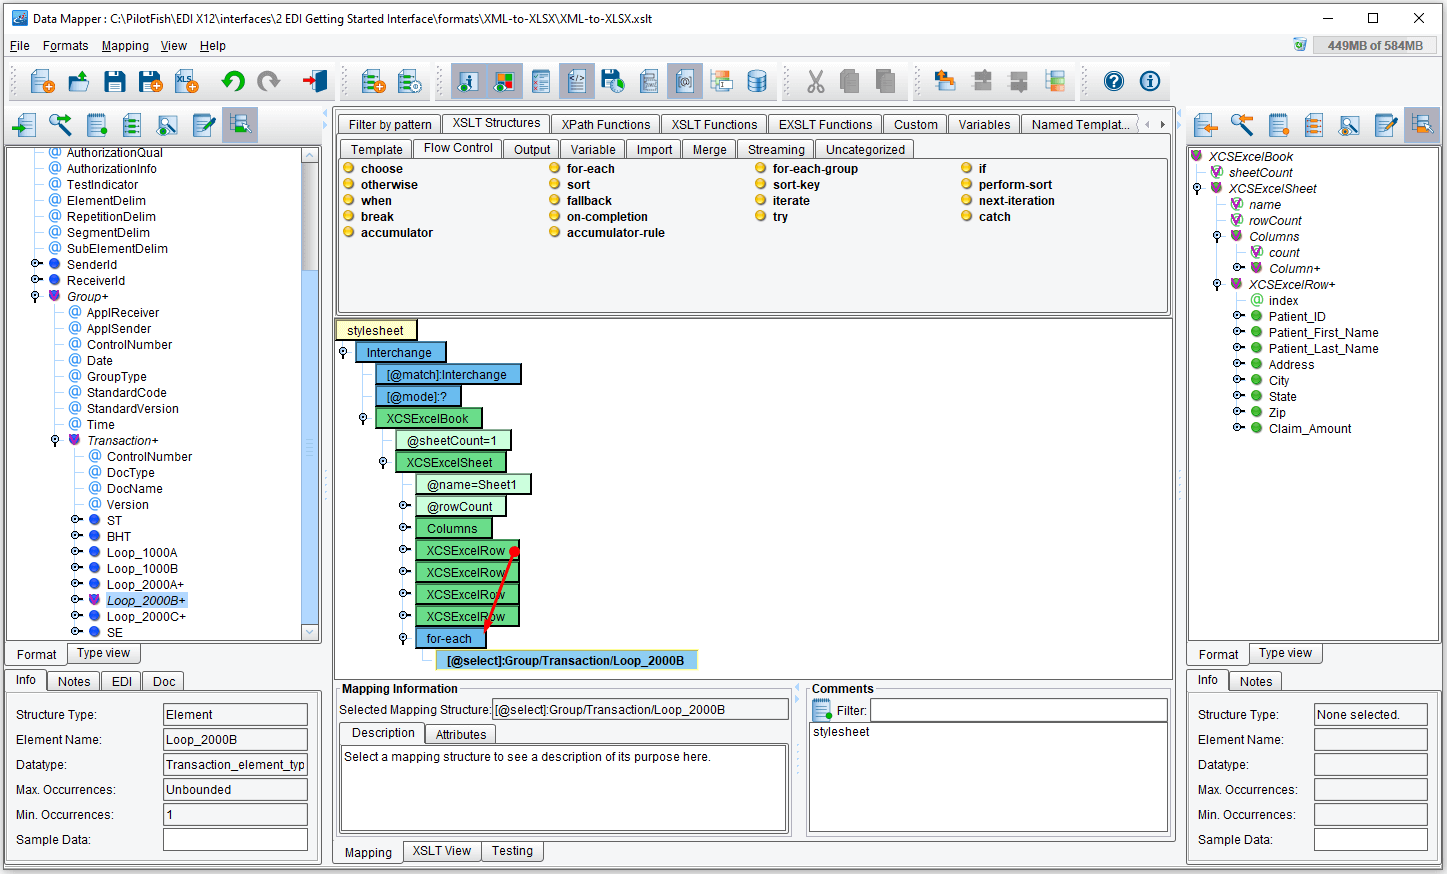
Now, we’ll want to make the row a child of the for-each node. Left-click the XCSExcelRow element (the text will get bolder as you do this) and drop it on top of the for-each. The final for-each structure is shown below.
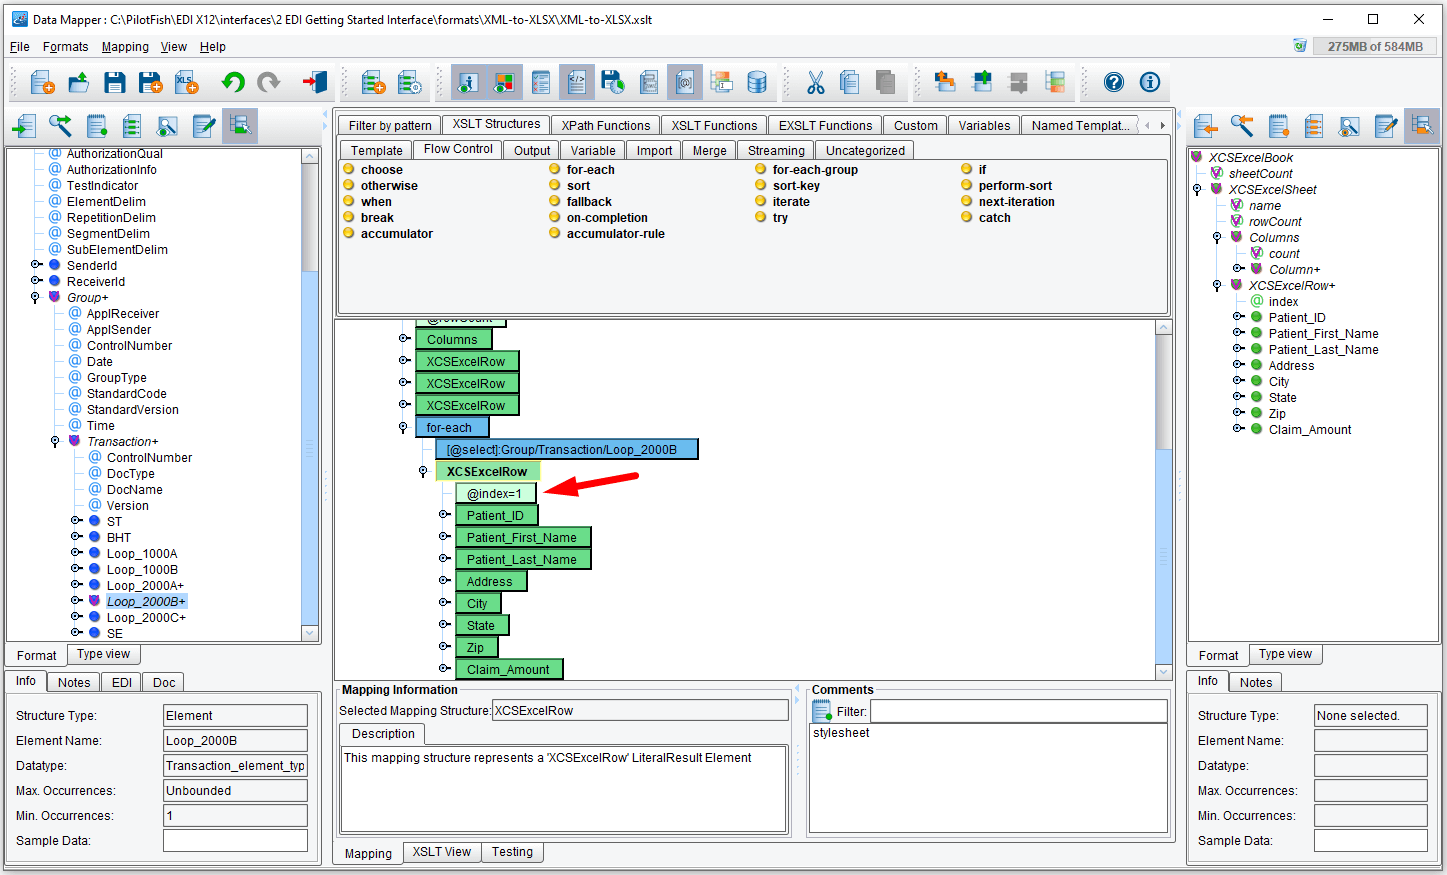
Next, we’ll need to add a dynamic value to the XCSExcelRow element that we’re building. Notice the @index attribute has a value of 1. This means that each iteration of our for-each will have an index of 1. We need a dynamic value though, that represents the true row number when we have input with multiple claims.
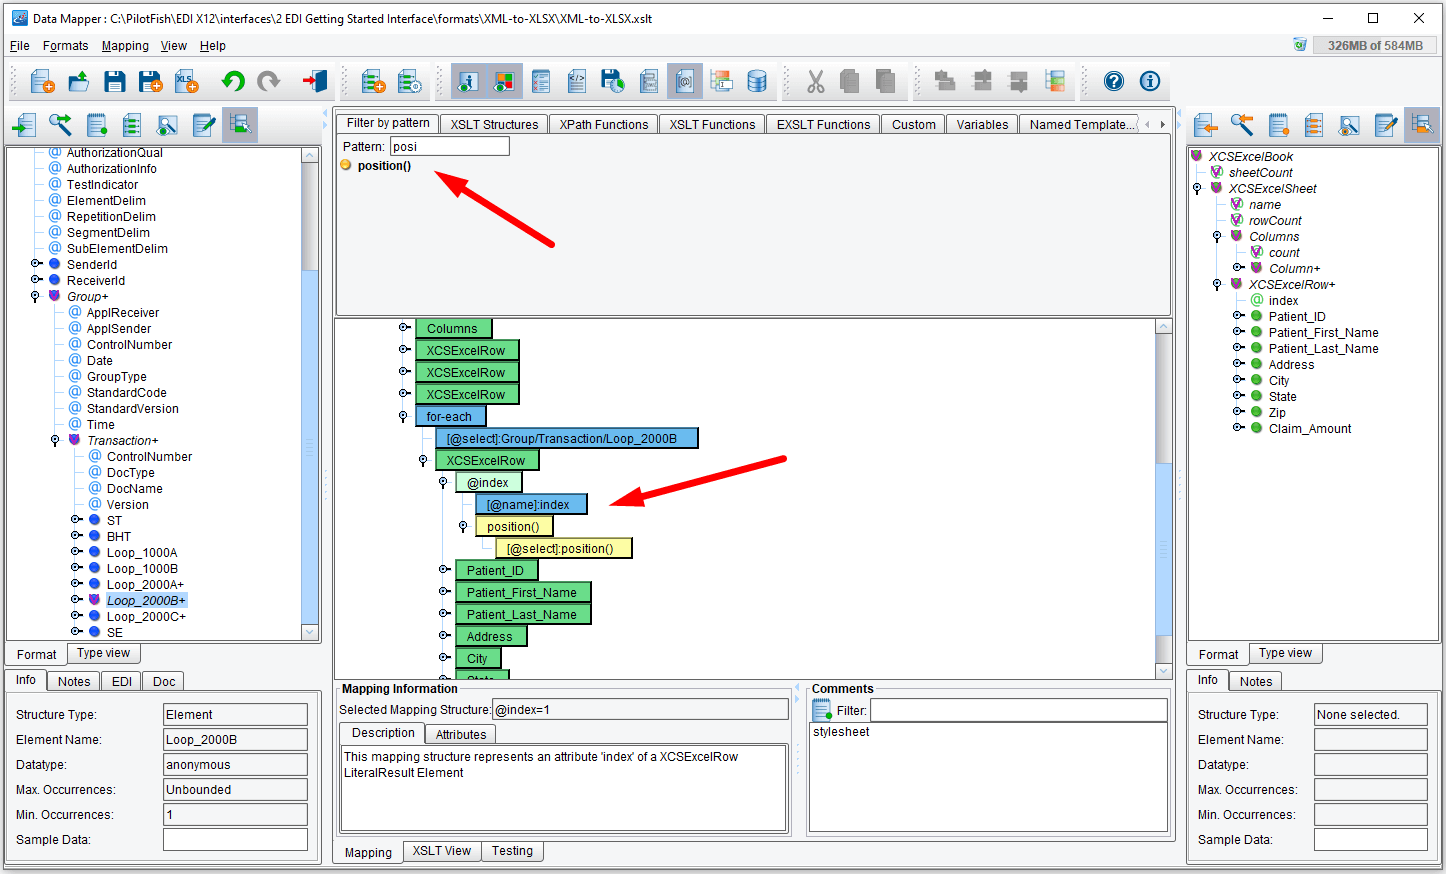
This process will be identical to the rowCount replacement done above, but we’ll use the position() function instead of count(). The final structure for the index attribute is shown below. Notice the node turns yellow when dropping the position() node, indicating we’re using a dynamic XSLT function instead of the static value of ‘1‘.
Let’s go ahead and drag & drop to populate a few additional pieces of information. Expand the Patient_ID node.
You’ll see a Text node with the value ‘1‘, generated from our Target sample data.
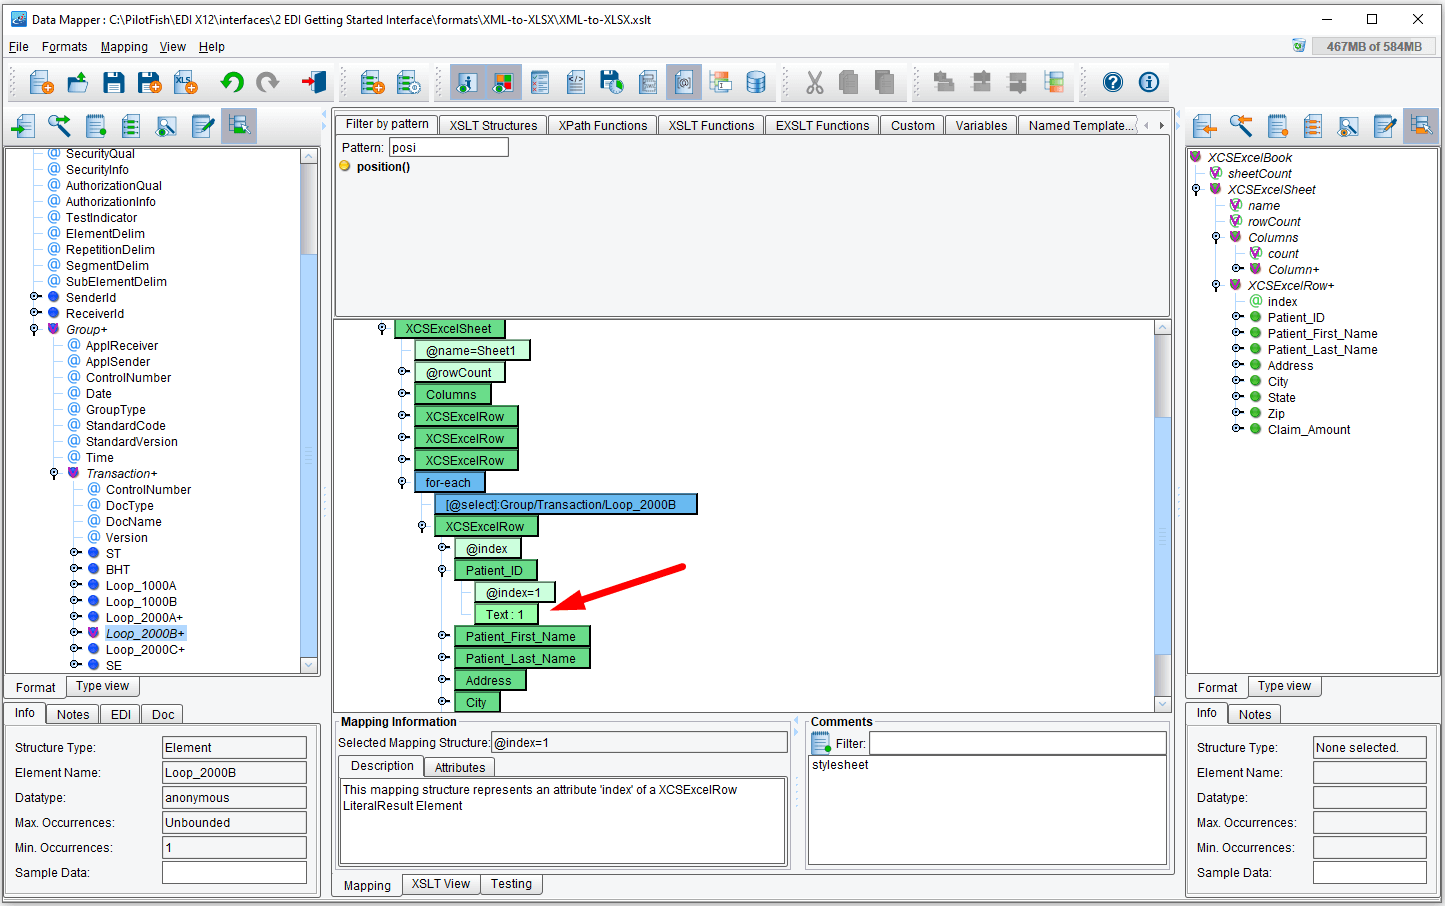
Select the Text node, right-click, and select Delete from the drop-down. Your mapping should now match the one below.
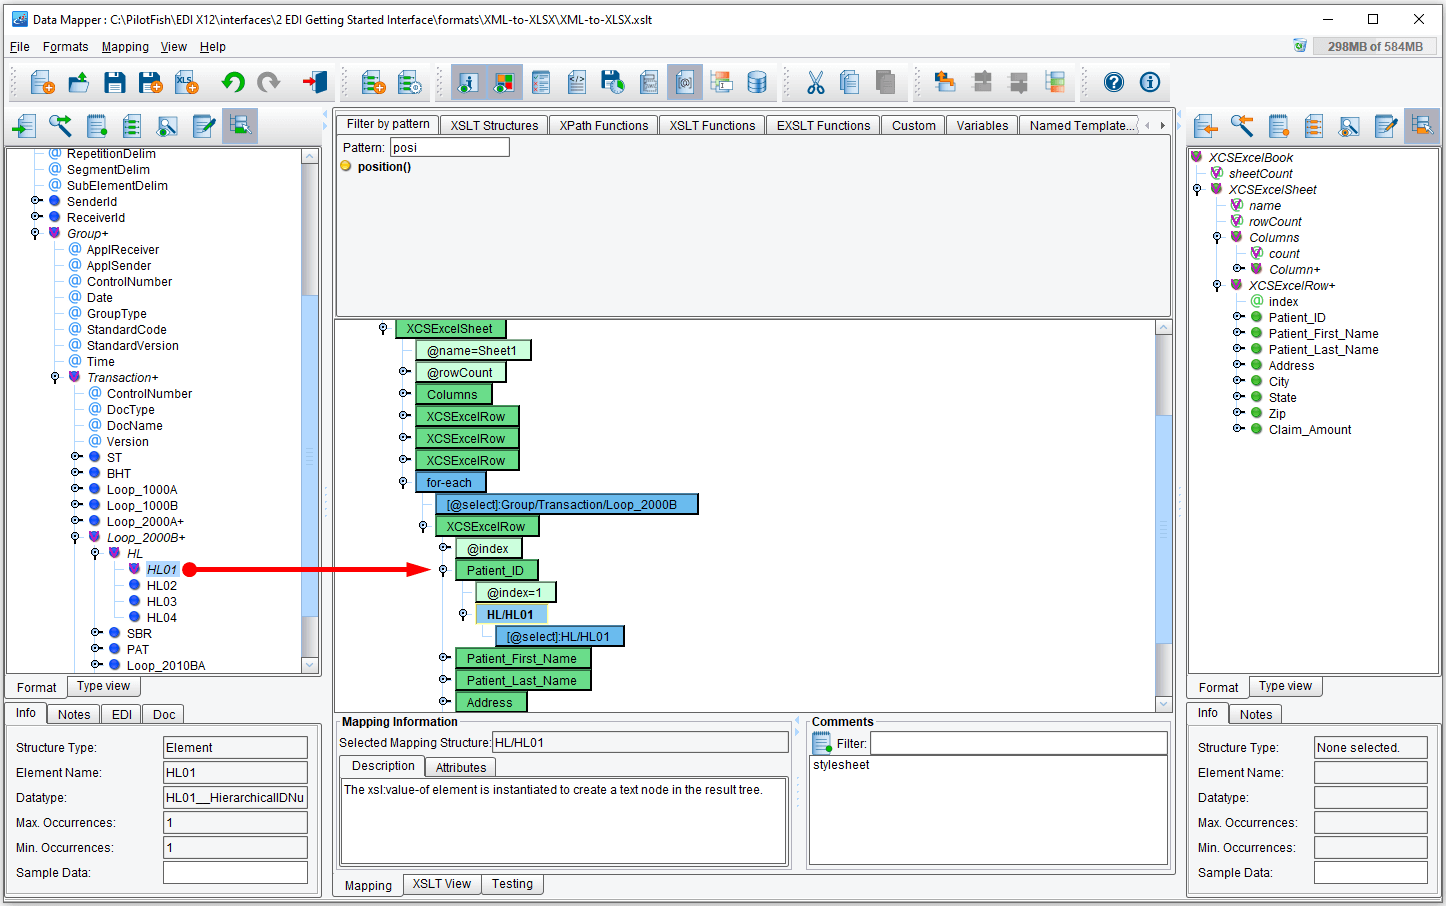
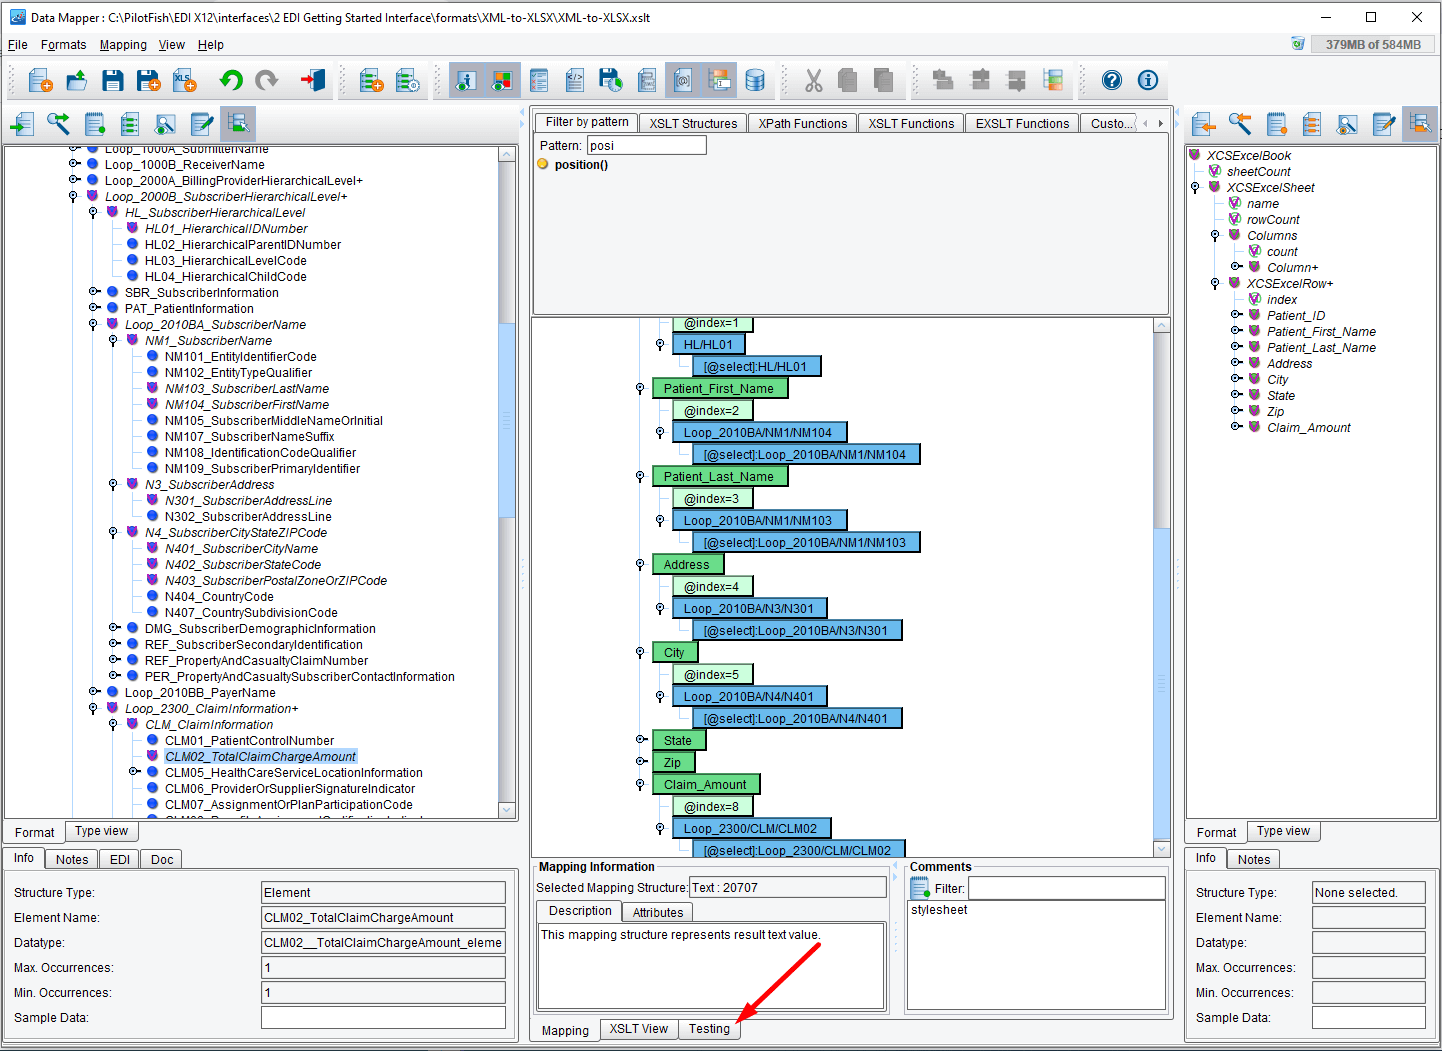
Now we’re ready to populate our Patient_ID node. Expand the Source format tree to show the node you’d like to populate with, in this case, our HL01, and then drag the blue node into our center pane. Drop it on the Patient_ID node, and it will be added to the mapping. The result is shown below.
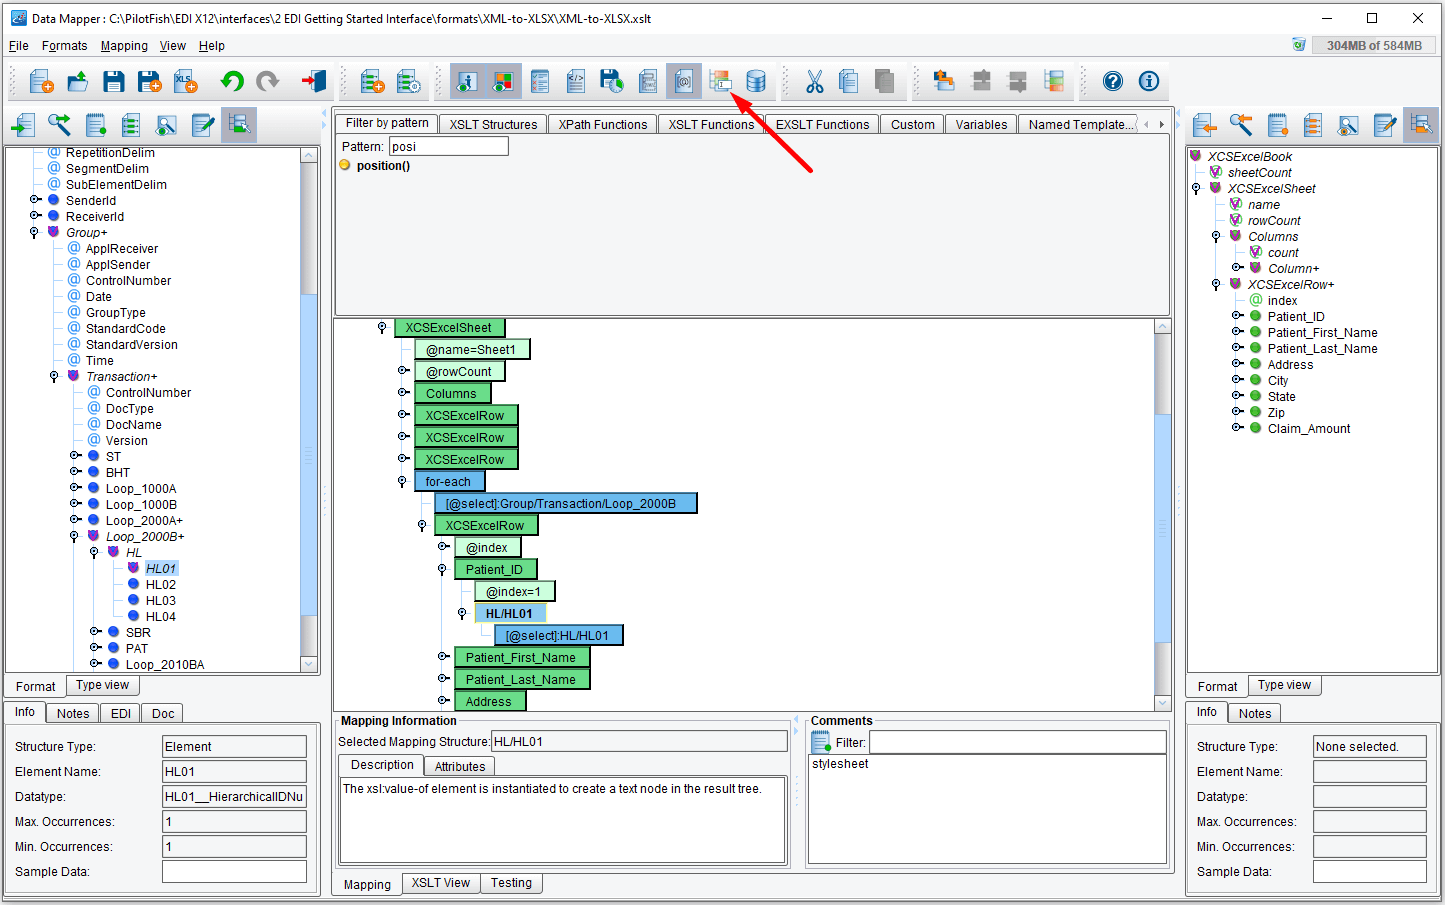
At this point, the remaining green nodes can be mapped using the same technique as the Patient_ID node. One feature that makes this much easier is the ‘Friendly Naming’ option, which adds more human-readable names to the EDI elements on Source format. Click the ‘Enable Friendly Naming’ button (highlighted above), and see that the EDI elements are much easier to identify.
Using the Friendly Names, see if you can map the remaining EDI values onto the center mapping. The Claim_Amount value is shown in the screen below, as well as the values for Patient_First_Name and Patient_Last_Name.
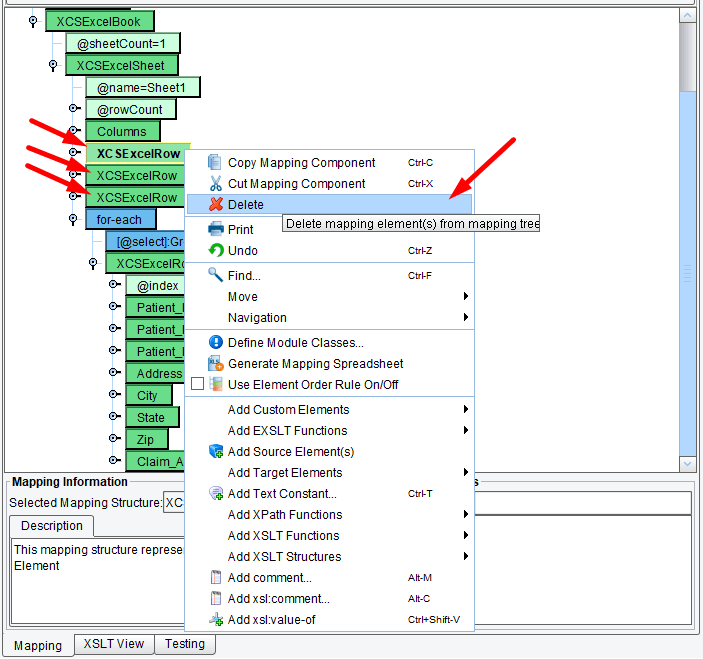
Now, delete three XCSExcelRow nodes by selecting Delete from the drop-down.
After your mapping is complete, click the Testing tab at the bottom of the center panel to go to Testing Mode.
Load in the sample EDI-XML provided by clicking on the Folder icon highlighted below and selecting the appropriate file in the chooser dialog. Next, click the green arrow Start Test and the Results pane will populate with the results of the sample data provided.
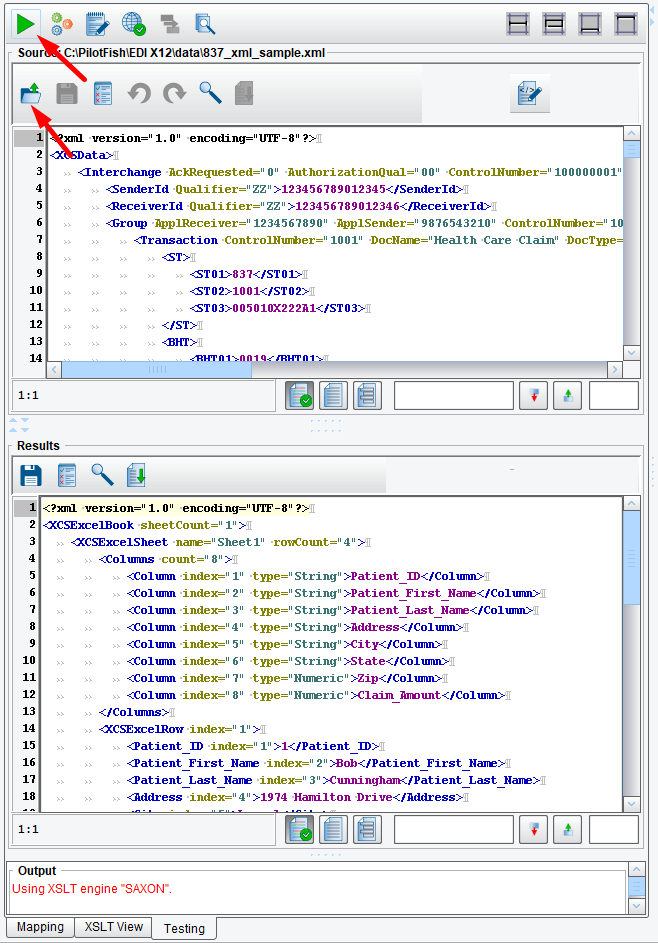
Select the framed icon to expand the Results panel and look at the end result. Notice that the rowCount and index attributes have been populated with the dynamic values we assembled via XSLT functions, in addition to the other data we mapped via drag & drop.

Now that our mapping is complete, select File -> Return to Console… and make sure to save when prompted!
Configuring the Transport Stage
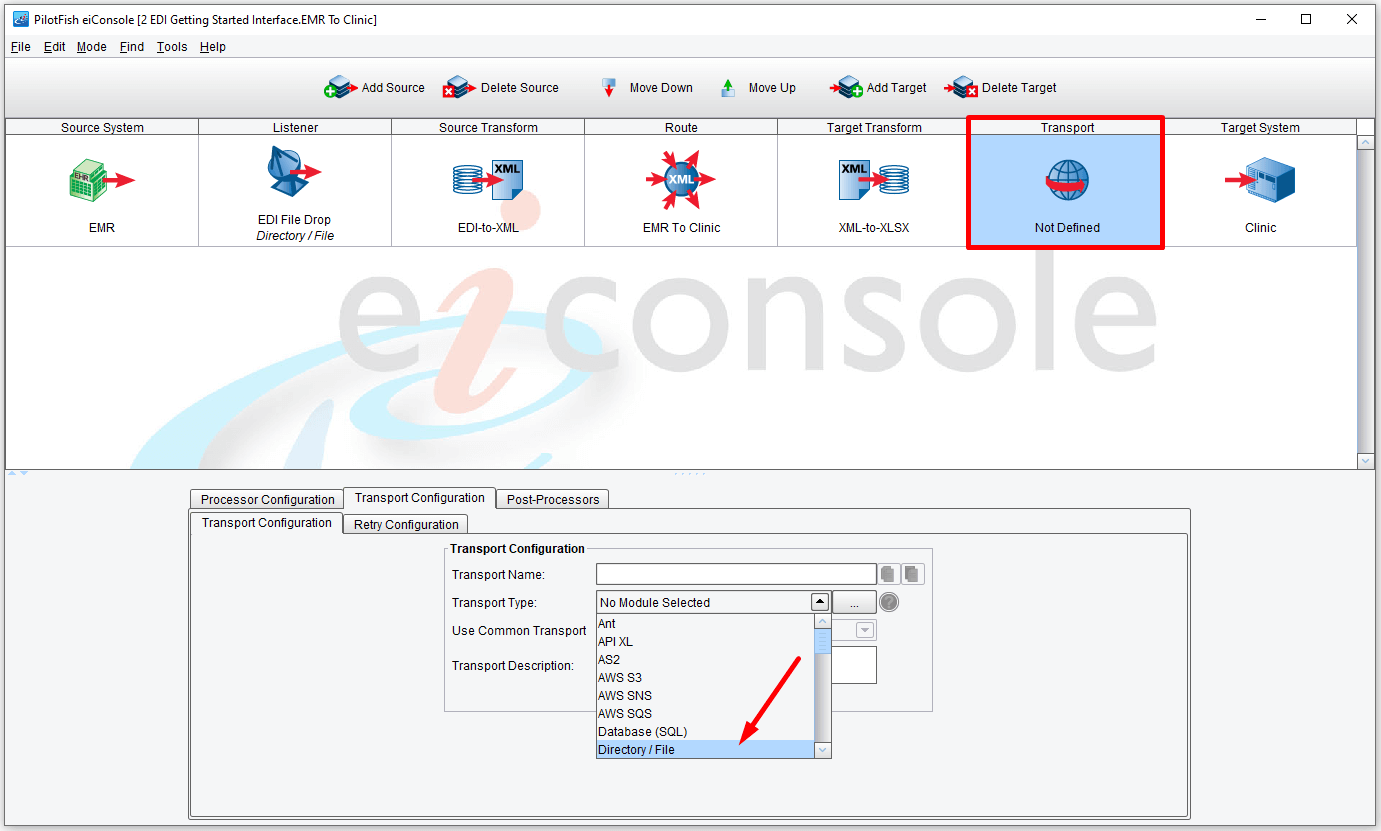
Now that our mapping and Target Transform are complete, it’s time to configure the Transport stage. Here we’ll configure how we’d like to Transport the data to our Target system. In this case, we’re just going to be dropping a file into a directory.
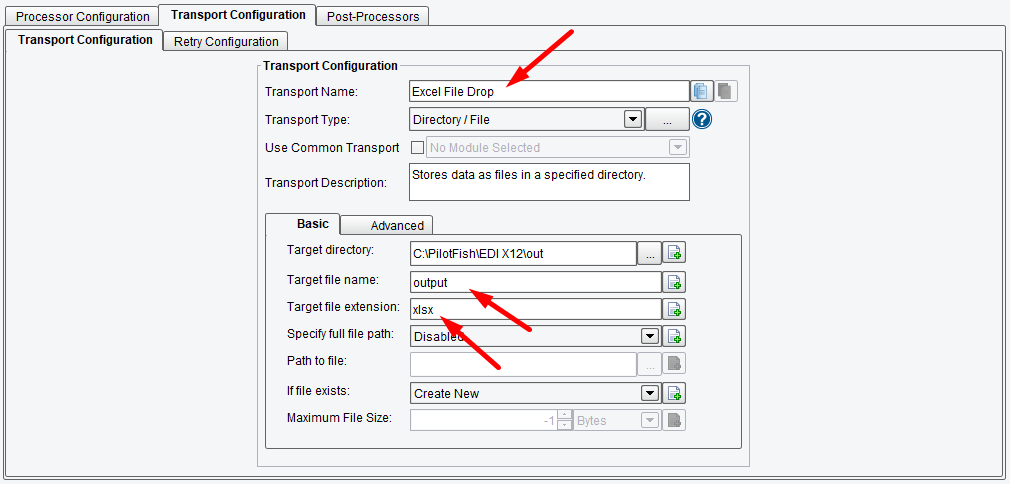
From the Transport Type drop-down, choose Directory / File.
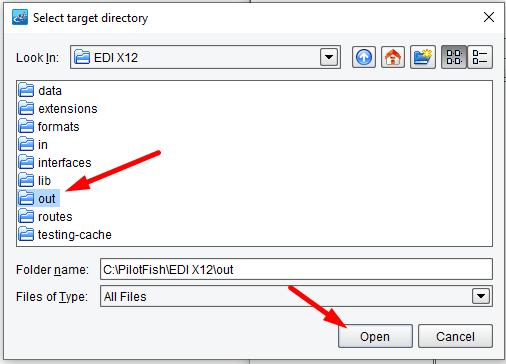
This opens the Transport Configuration panel. The configuration here is very similar to the Directory Listener. First, click the Ellipsis button next to the Target directory.

Select the “out” directory and click Open.
Next, supply a Target File Name (in our case, output, and xlsx for the Target file extension) and enter a more descriptive Transport name, i.e. Excel File Drop.
At this point, our entire Transformation is configured. Our interface will pick up EDI input from the specified directory and transform that EDI into XML. That EDI-XML will then be converted into an Excel spreadsheet format, transformed into actual Excel and deposited by our Directory Transport.
Now that we’ve configured our interface, let’s see if it works.
Testing the Interface
From the ‘Mode‘ menu, select ‘Testing Mode‘.
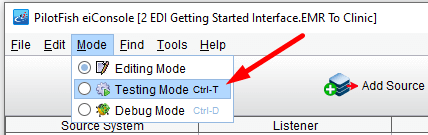
Make sure to save when prompted.

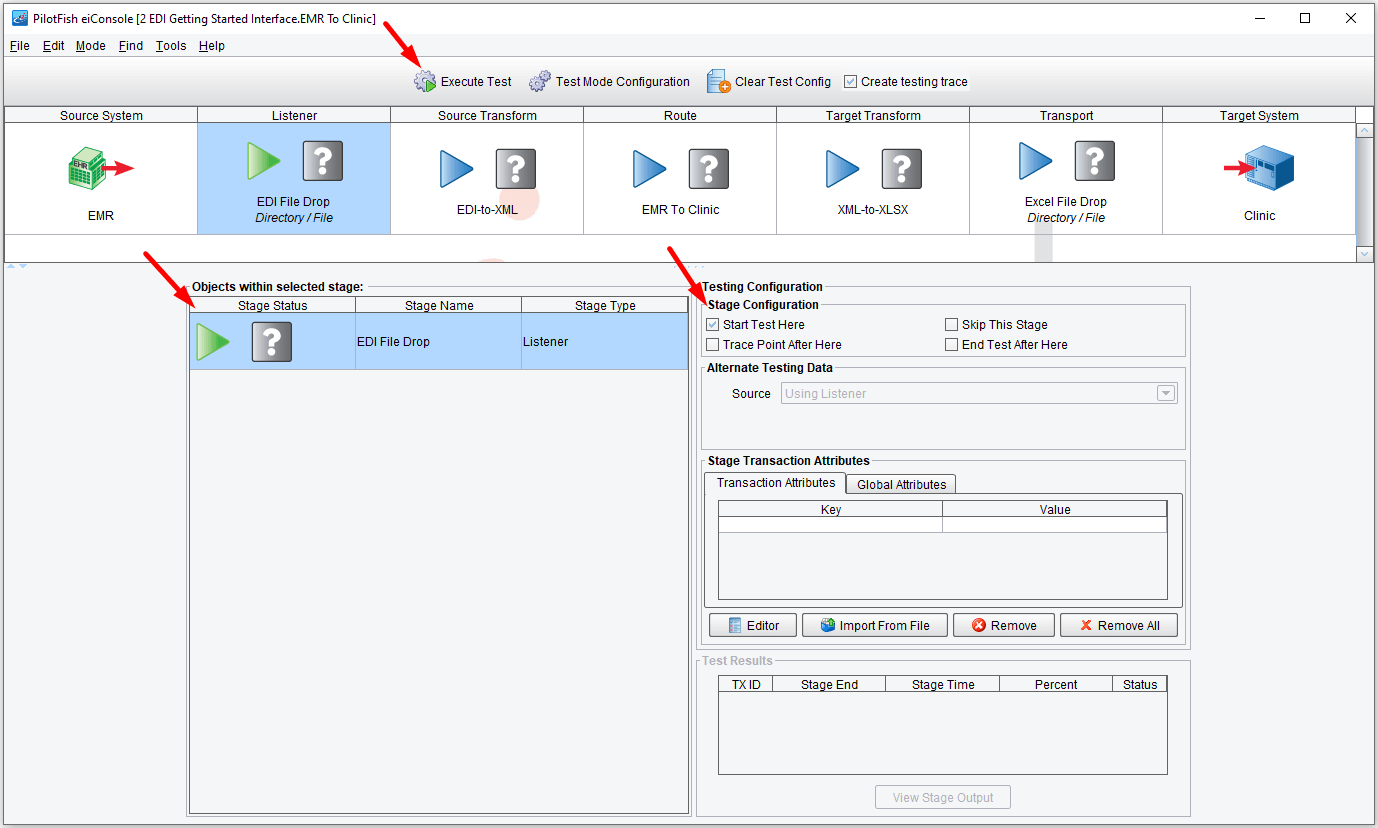
The eiConsole’s inline Testing Mode opens. Here, we see our same route topology (Source System, Listener, Source Transform, etc.) but this time, our icons are replaced with question marks and arrows to indicate Stages of a test we can run and the path that it’s configured to execute.
We’ll start our test at the Listener stage, indicated by the green arrow.
Click the Execute Test button to start your test.
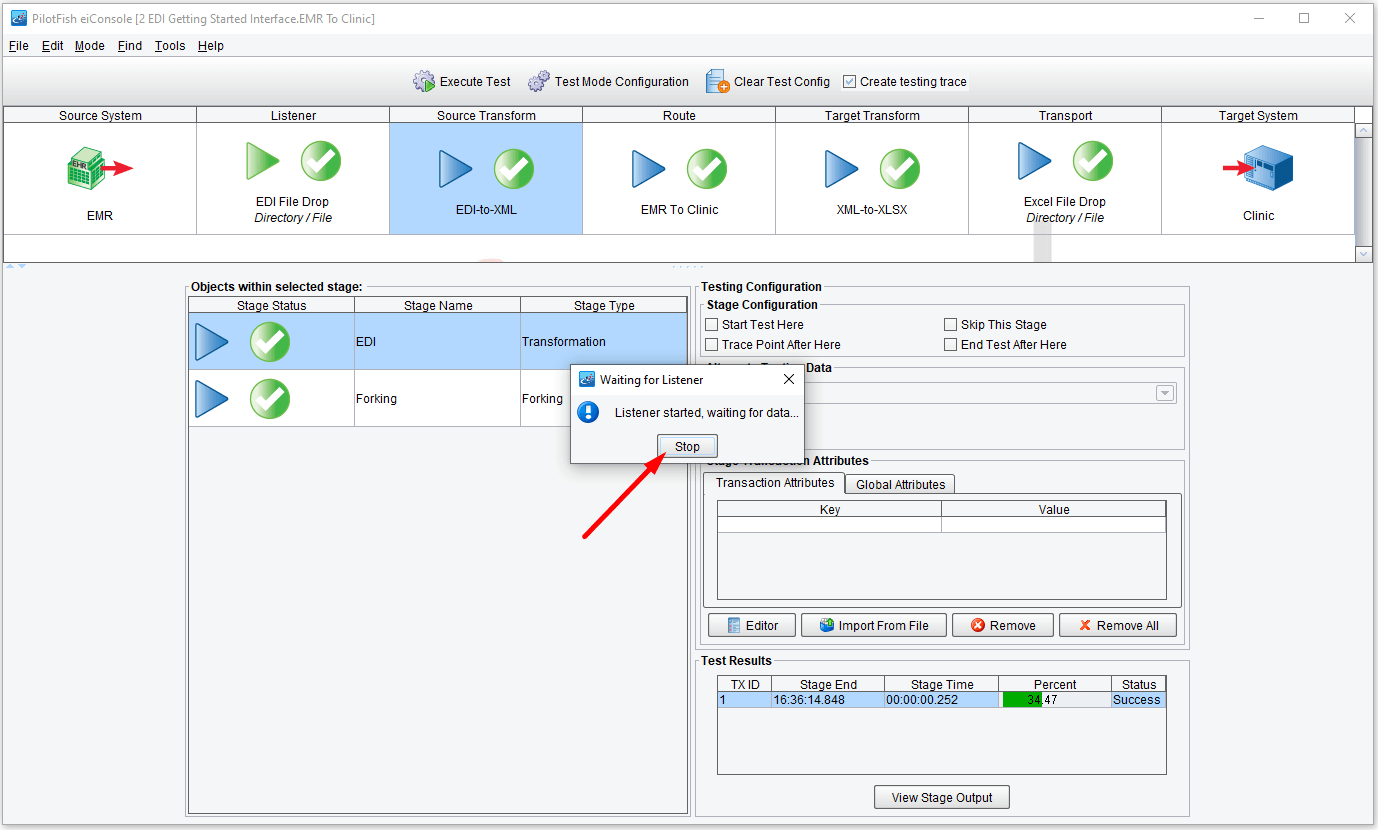
The Listener will start polling every 10 seconds waiting for an EDI file to appear in the input folder that you designated.
As each stage completes, the question marks turn into green checkmarks. What a beautiful sight! Or, if you had a failure, you will see a red X.
Here we can take a look at how the data appeared at each point.
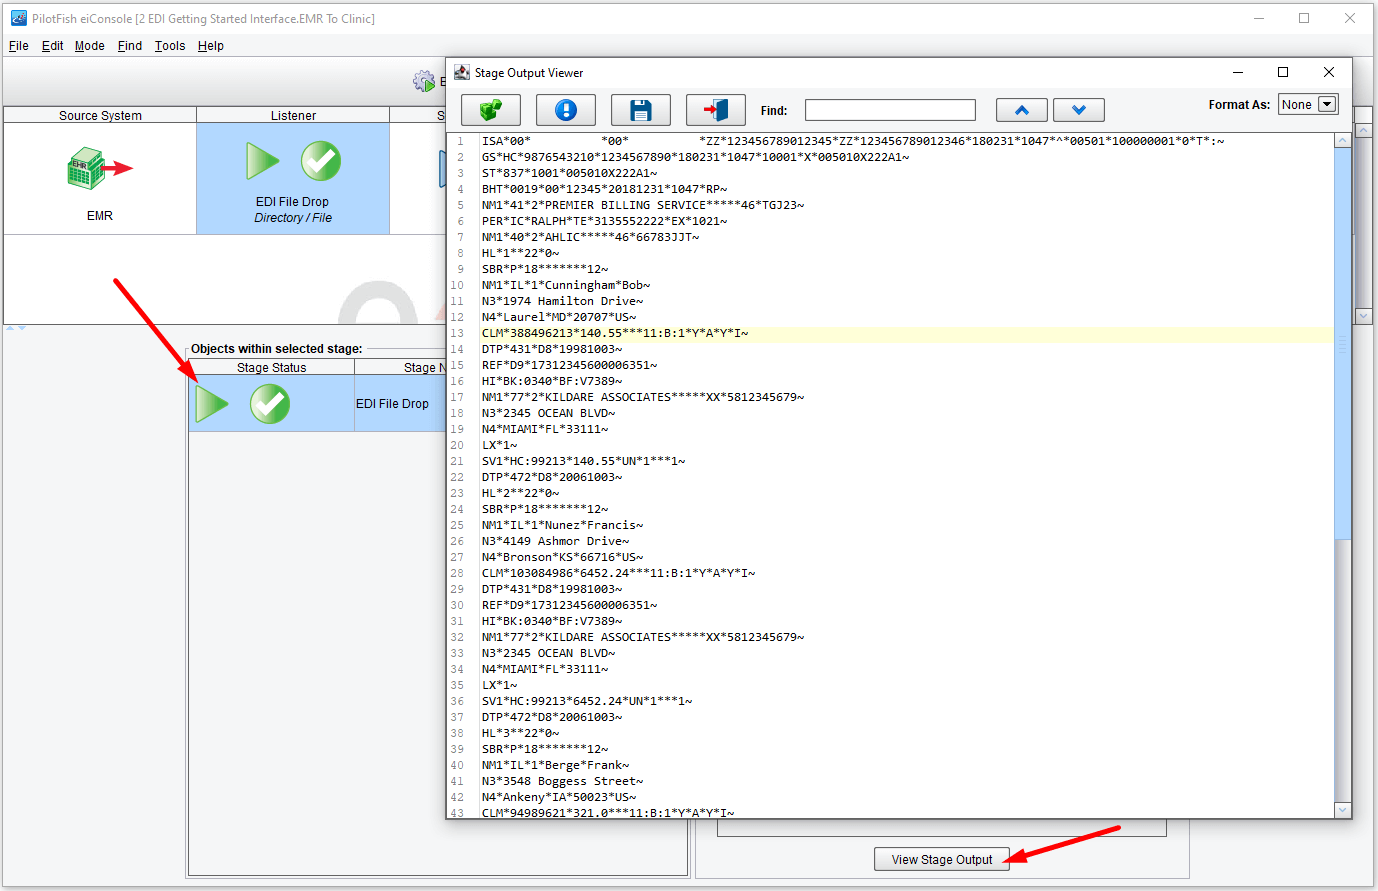
To view our data as it travels through our Route, you can click on the Listener stage, double-click the EDI File Drop stage name (in the Objects, within the selected stage grid.), or click the ‘View Stage Output’ button.
Here, you can see the unaltered EDI input that our Directory Listener picked up.
Next, select the Source Transform stage and click View Stage Output.
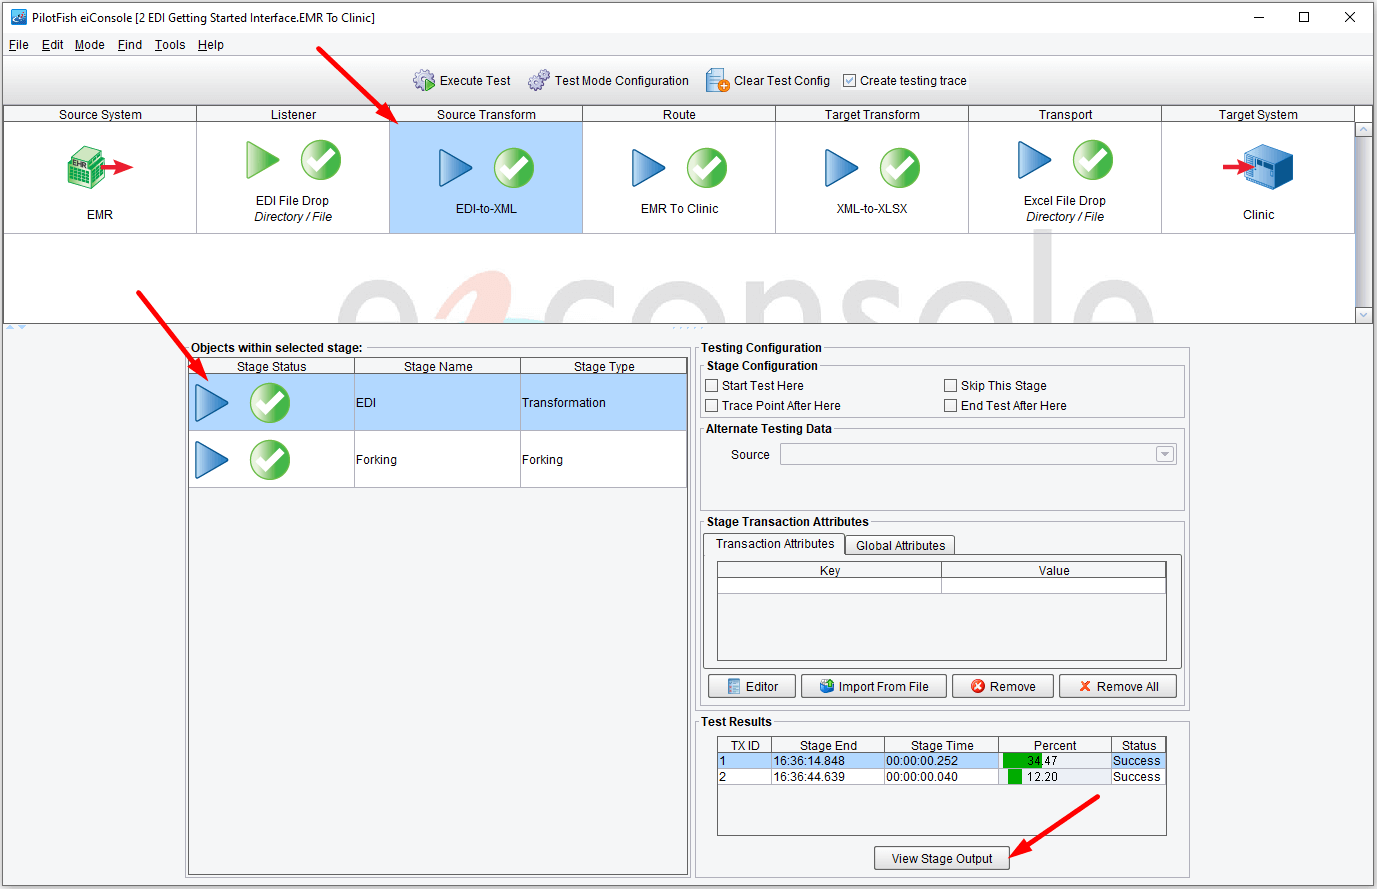
Here, we see our EDI has been transformed into XML. By selecting XML from the Format As: drop-down, we can make our stage output much easier to read.
Here we see our properly formatted XML – complete with looping contexts. Since we selected the Friendly Naming option on our EDI Transformer, each node also has a ‘Name‘ attribute which gives extra context and clarity to the EDI segments and elements.

Next, view the stage output from the Target Transform stage.
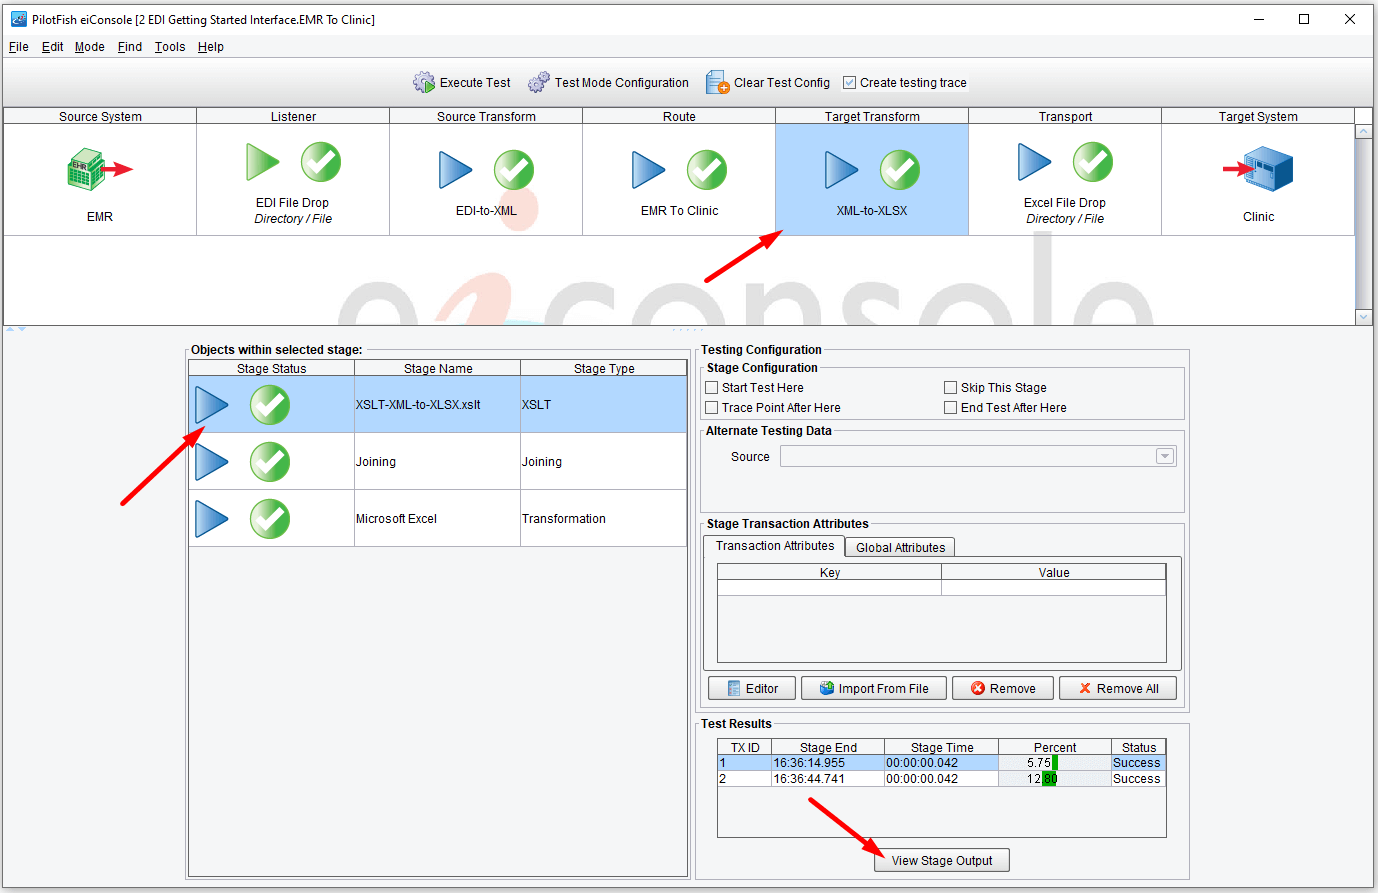
From the XSLT stage, we see the output generated from the Data Mapping we made. Notice the XCSExcelRow elements have all been populated properly, as well as the dynamic index and rowCount attributes we programmed with XSLT functions.

Finally, we’ll look at the stage output from the Target Transform stage. This is our generated XSLX worksheet in binary form, so it doesn’t look like much of anything. We’ll need to view it in Excel to see if we were successful.

Success! See the columns we mapped, with each individual claim in its own row. The ‘Add Header‘ option in the Excel Transformer applied the column names directly into the Worksheet for easy viewing.

We successfully created an interface to pick up incoming X12 EDI, transformed it to XML and then, using the Data Mapper, turned that XML into an easily deliverable Excel worksheet.
Browse through the video demos available to learn more about how you can leverage the EDI-specific features and components of the eiConsole. Also, check out advanced topics to handle virtually any integration scenario with the eiConsole.