eiDashboard v.19R1
Microsoft Windows Installation and Configuration
Recommended Installation Environment
- eiDashboard version 19R1
- eiPlatform & eiConsole Windows installation bundle of a matching major version (19R1)
- Microsoft Windows 8+
Installation Overview
Installation instructions will vary, depending mainly on the preferred mode of operation and application deployment. If only Basic Statistics Mode is needed (simple transaction throughput statistics), then the configuration will be minimal. Full multi-eiPlatform Enterprise mode with Transaction Logging will require a more in-depth configuration.
Every eiDashboard installation will follow the same basic steps:
- Install or upgrade the eiPlatform and eiConsole (not covered in this guide)
- Install the eiDashboard core
- Configure eiPlatform and eiDashboard settings
- Configure users and access permissions (covered in detail here)
Installing the eiDashboard Core
The Windows Installer provides a guided process to install the eiDashboard and prompts for the required port and URL information. If this information is not known at the time of installation, the default values can be used for now and easily changed later.
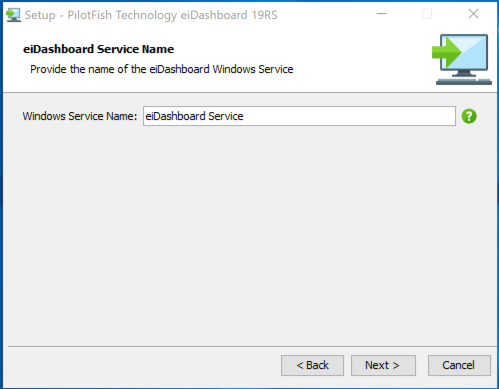
eiDashboard Service Name
On this page, you have the option of selecting the name that Windows will use for your eiDashboard Service. It can be named whatever you’d like, though choosing an intuitive name or keeping the default is recommended.
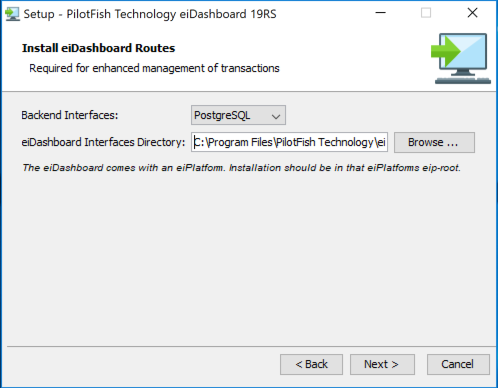
eiDashboard Routes Installation
A requirement for enabling transaction logging in the eiDashboard is the installation of specialized routes for an eiPlatform to run. PostgreSQL and Microsoft SQL Server have transaction logging implementations. Each implementation will be available under the ‘Backend Interfaces’ dropdown. The installation location of the chosen implementation will default (if available) to an installed eiPlatforms eip-root configuration directory.
Further transaction logging configuration is covered here: https://cms.pilotfishtechnology.com/eidashboard/transaction-logging-mode/configuration
eiDashboard Windows Service Configuration
Since the eiDashboard and eiPlatform communicate through an internal RESTful API, it is important they are able to communicate properly over your network. These values can vary greatly depending on your network topography, but they are easy to change later – so feel free to leave the default values if you are unsure during installation. The eiDashboard Port setting is the port you would like the eiDashboard to be available from. Be sure to choose a port that is available to avoid conflicts with other programs. The default is port 8989.
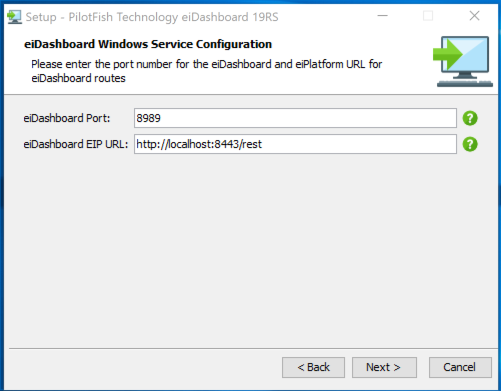
The eiDashboard EIP URL setting is the URL where your eiPlatform’s internal API is located. The default value is recommended for standard eiPlatform installations.
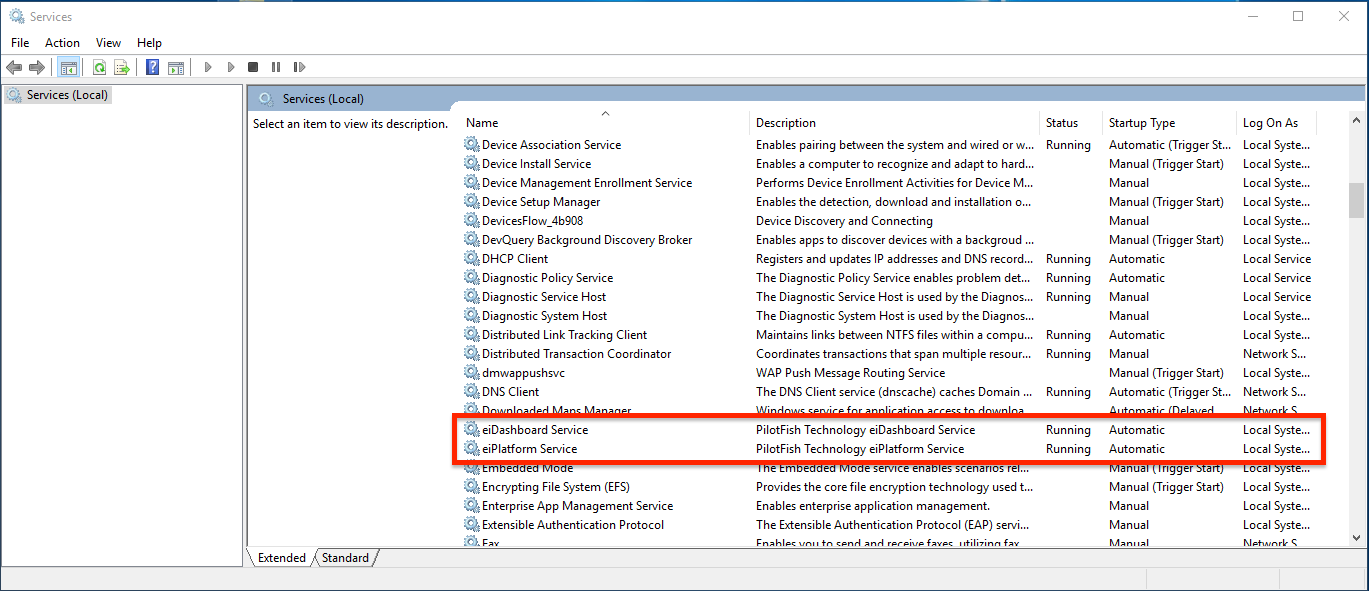
Starting and Stopping the eiDashboard Windows Service
Starting and stopping the Windows Service can be done through the ‘Services’ menu, available through the Windows system settings. The screenshot below shows both the eiDashboard and eiPlatform services, though the names of each will vary if changed during installation.
eiPlatform and eiDashboard Configuration Settings
After installing the core eiDashboard product, we must configure several items to ensure it is able to communicate properly with your eiPlatform instances. Some of these configuration values will vary depending on your specific architecture setup, but the settings and their locations are standard across installations.
eiPlatform Configuration Settings
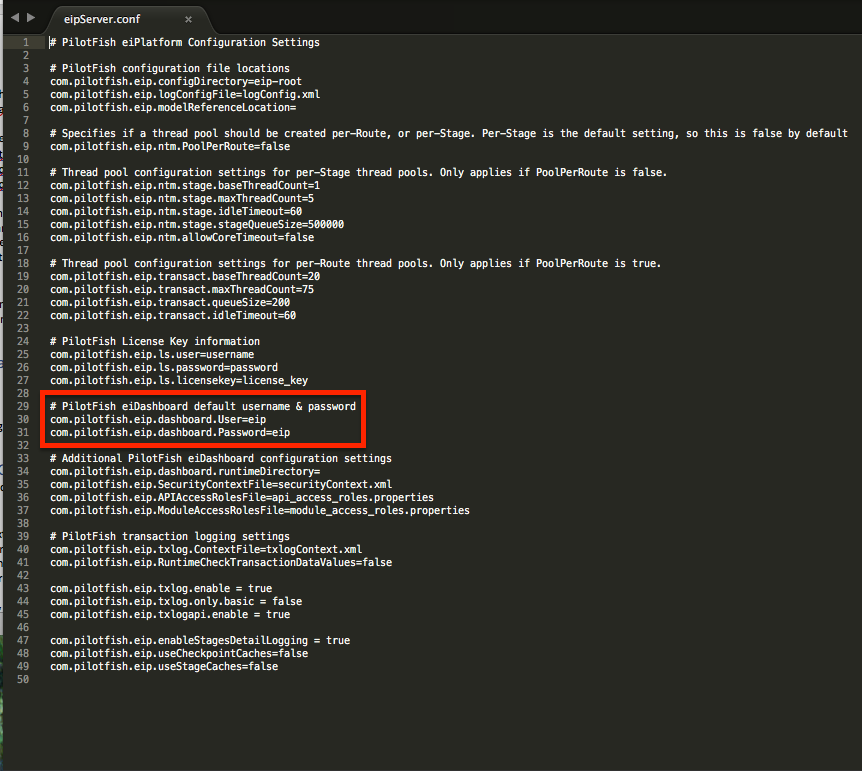
There are only three settings we’ll need to add to the eiPlatform’s eipServer.conf file to enable the basic operation of the eiDashboard, although there are a few more settings needed to enable additional functionalities.
First, we’ll need to create credentials for the eiPlatform Super User. These two settings are:
- com.pilotfish.eip.dashboard.User = <Admin Username>
- com.pilotfish.eip.dashboard.Password = <Admin Password>
This user will be able to log into the eiDashboard no matter the other user settings defined in the eiDashboard itself and will have unrestricted access to content, user creation and security settings. It is intended for use by the administrator of your PilotFish architecture to create new users and access capabilities.
Note: For a fresh installation of the eiPlatform, these settings may already be defined but left without values. It is important to create these Super User credentials since, without them, the eiDashboard’s login functionality will be limited.
The screenshot below shows an example of an eipServer.conf file with the pertinent eiDashboard settings highlighted. Your particular configuration file’s contents may vary.
eiDashboard Configuration Settings
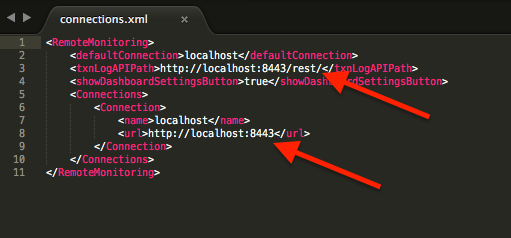
These settings were initially set in the installer, however configuration after installation modifying the connections.xml file. It can be found in the WEB-INF directory of the eiDashboard installation. This XML file contains the information needed to connect the eiDashboard with an eiPlatform instance. Generally, you will only be concerned with two elements:
- The <txnLogAPIPath> element. This setting is most important when using Transaction Logging Mode and points to the URL path of the eiPlatform where the transaction logging interfaces are running. If you are only using Basic Statistics Mode, this setting should be left blank.
- The <Connections> elements. There may be multiple <Connection> elements depending on the complexity of your PilotFish architecture, but each one represents an eiPlatform instance connection. The <url> element of each should point to the eiPlatform’s API root, generally http://<URL Path>:8443 for Windows installations.
Default connections.xml settings:
 Note: Changing the eipServer.conf or connections.xml settings will require a restart of the pertinent service (eiPlatform or eiDashboard).
Logging In and eiDashboard Settings
After setting the internal configuration and restarting the Service, the eiDashboard is operational in Basic Statistics mode and ready to go! The next steps are to log in for the first time, check and edit the global eiDashboard settings if desired and configure the user and access capabilities.
Loading and Logging In
Since the eiDashboard is an entirely web-based application, it can be accessed from any web browser or mobile device with internet capabilities. The screenshot below shows the initial eiDashboard login screen.

Since no eiDashboard users currently exist in our fresh installation, we’ll log in with the Super User credentials configured in the previous steps. (For this example ‘eip’ / ‘eip’). If our connections are set up properly, we should be redirected to the eiDashboard Front Page. If there are any errors logging in, a bad password or connection setting (for example), notifications will display on the right side of the screen describing the error. The screenshot below shows the eiDashboard Front Page.
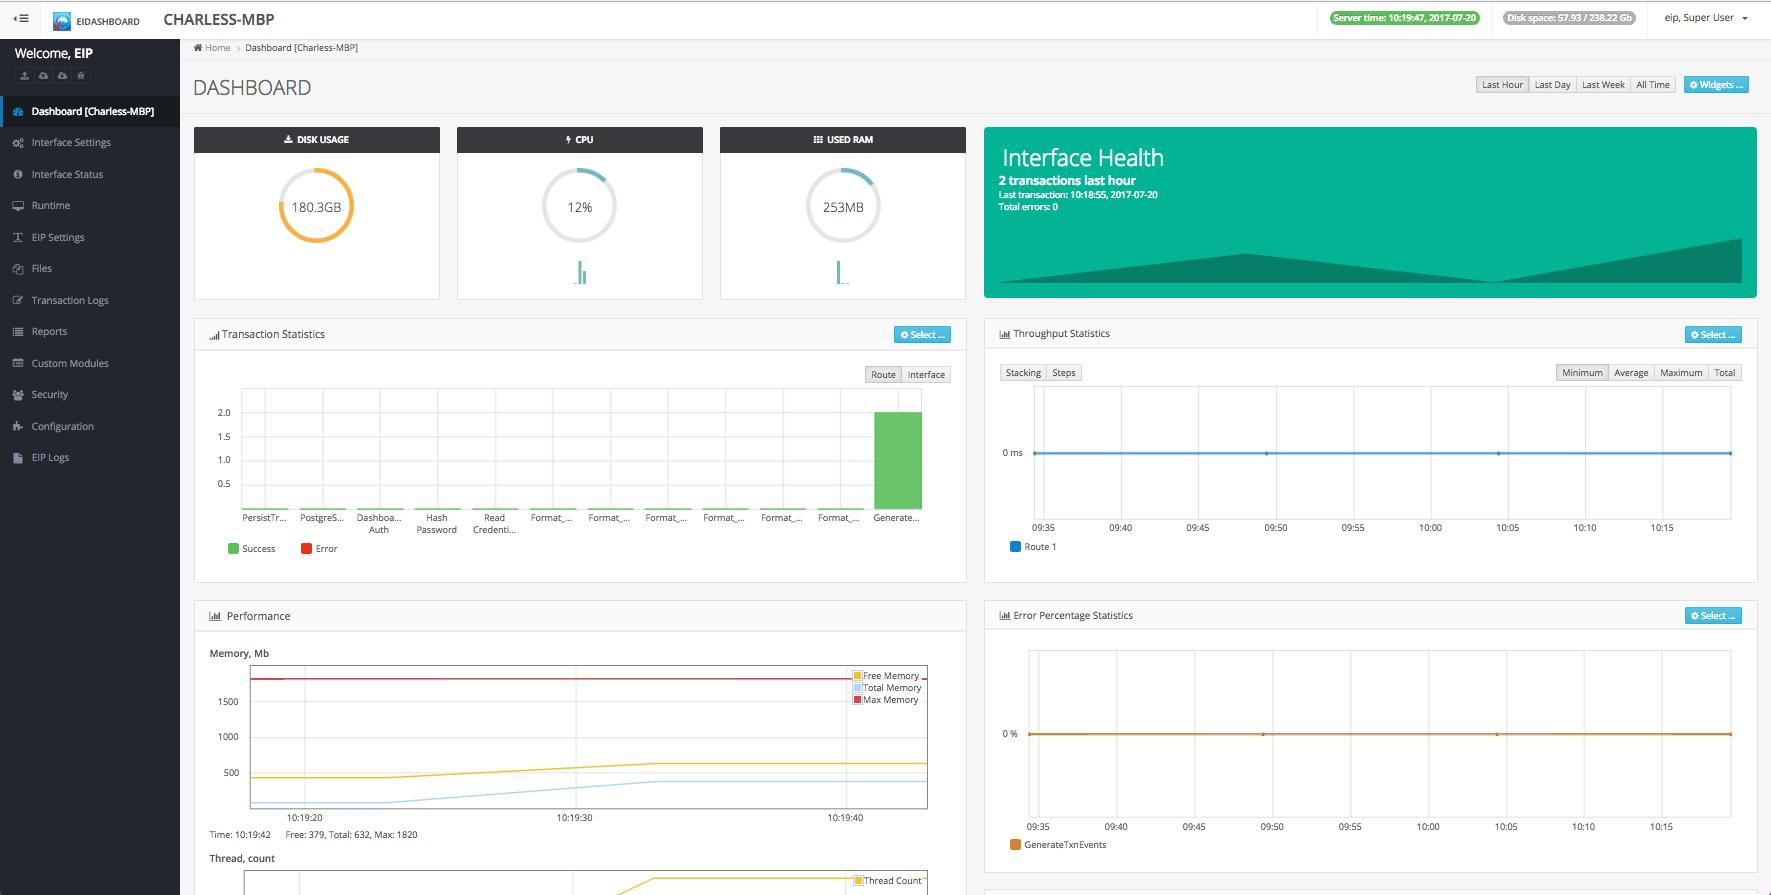
Each piece of functionality is described in more detail in the CMS page for that feature. So, for now, we will only concern ourselves with the ‘Settings’ page.
Internal Settings
Next, we’ll check the eiDashboard internal settings. These are separate for each user and handle visual settings within the eiDashboard like the color scheme, toolbar placement, etc. To get to the Settings menu, click on your username in the top-right and then select the ‘Settings’ option in the drop-down that appears.
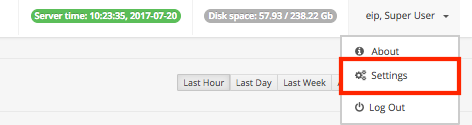
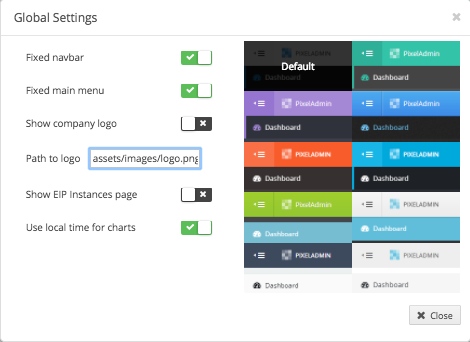
The Global Settings menu is shown below. Each setting is fairly self-explanatory and deals primarily with visual aspects of the eiDashboard. Any changes are immediate, so once you are done the ‘Close’ button will take you back to the Front Page.
Next Steps
At this point, the eiDashboard is fully operational in Basic Statistics mode, also called ‘Bare-bones mode’. This mode allows for the eiDashboard to connect to one eiPlatform at a time and users can log in using either the Super User credentials defined in the eiPlatform settings or any user credentials that have been defined within the eiDashboard itself.
In Basic Statistics mode, basic transaction statistics are available – including throughput and transaction success or error metrics. To extend the eiDashboard’s functionality through the Transaction Logging and/or Enterprise Modes, additional configuration is required. For additional information on each of the extended modes and installation instructions, see the following links:
Generally, the next step in the installation process is to configure users and access permissions. An in-depth guide to the eiDashboard’s user administration system can be found here.
Troubleshooting
The following section covers some common installation and configuration issues you may have, typically when first attempting to log into the eiDashboard. Due to the complexity of many network systems, establishing a proper connection between the eiPlatform API and the eiDashboard can sometimes take some tweaking.
Failed to Authenticate User
Typically authentication issues occur when the Super User configuration items are not set in the eiPlatform’s eipServer.conf file. These SuperUser credentials are only required if no internal eiDashboard users are defined, and can be safely removed once eiDashboard-specific users are defined.
Authentication errors can also happen if a user or capability is missing some access rules. For example, if the API Access rules are not set when creating a new capability, any users using that capability will have login issues.
Connection Issues
Connections issues also can occur when first configuring the eiDashboard. Double-checking your host and port settings is the easiest way to ensure these issues don’t happen. On a Windows Service installation, the eiPlatform API can be reached at simply ‘http://localhost:8443/’ by default. It can take some trial and error to get your eiPlatform and eiDashboard communicating properly but once the connection settings are set up correctly, there shouldn’t be a need to change them.
Additionally, when connecting the eiDashboard to an eiConsole running in Platform Emulator mode, the connection URL will be ‘http://localhost:9001/eip/’ and the txLogAPIPath will be ‘http://localhost:9001/eip/rest/’.
Transaction Log API Issues
When upgrading from the eiDashboard 1.0 to version 1.1, you may encounter some errors after logging in regarding the Transaction Log API, similar to the one shown below:
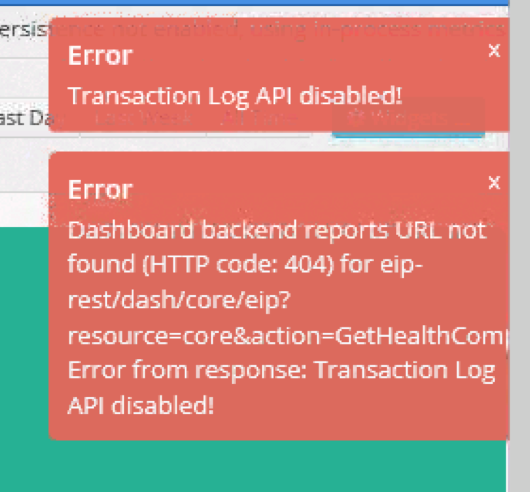
These errors are caused by eiDashboard-related eipServer.conf settings that have changed or been re-purposed since version 1.0 and can be fixed by removing the following settings (if they exist) in your eipServer.conf:
- com.pilotfish.eip.txlog.enable
- com.pilotfish.eip.txlogapi.enable
These settings are only needed for Transaction Logging Mode and when using Basic Statistics Mode they can cause conflicts if set incorrectly.
Nginx Reverse Proxy Issue
There is a possibility of issues when using an Nginx reverse proxy to connect to the eiDashboard. If the error “Upstream sent invalid chunked response while reading upstream” is encountered, the following setting needs to be added to the Nginx configuration:
- proxy_http_version 1.1;
Nginx documentation related to this error can be found here.