Debug Results
Debug mode represents the successful completion of a stage with green and unsuccessful stages with red. Additional result panes show more detailed information beyond simply “pass” or “fail.”
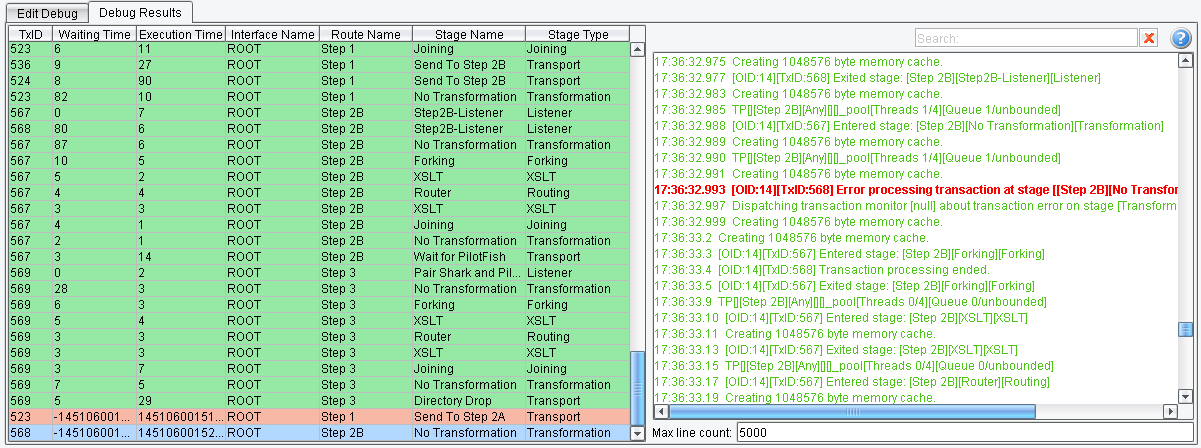
Most debug results are shown in the settings and result panels of the “Debug Results” tab. This tab consists of two parts: the results table and the logs panel.

Results are shown in the left-hand table (green indicating successful, red indicating unsuccessful) and contain general information about each stage of debugging. Right-clicking on table rows reveals a pop-up menu, showing logs for current original transaction ID or transaction ID.
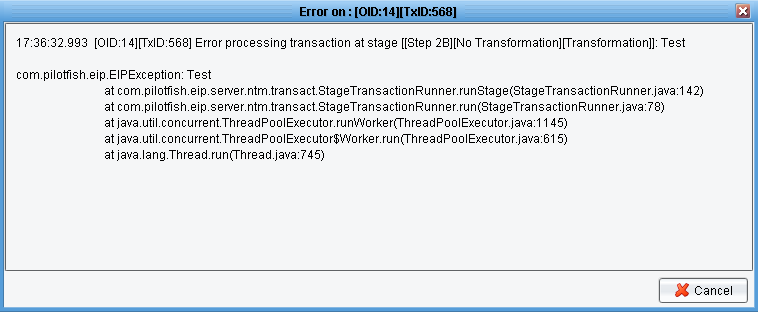
All server logs are displayed in the Logs panel. There is a filter in this panel to choose the necessary logs. Error logs are colored red and become active – when clicked on, they open windows with detailed information about the exception.

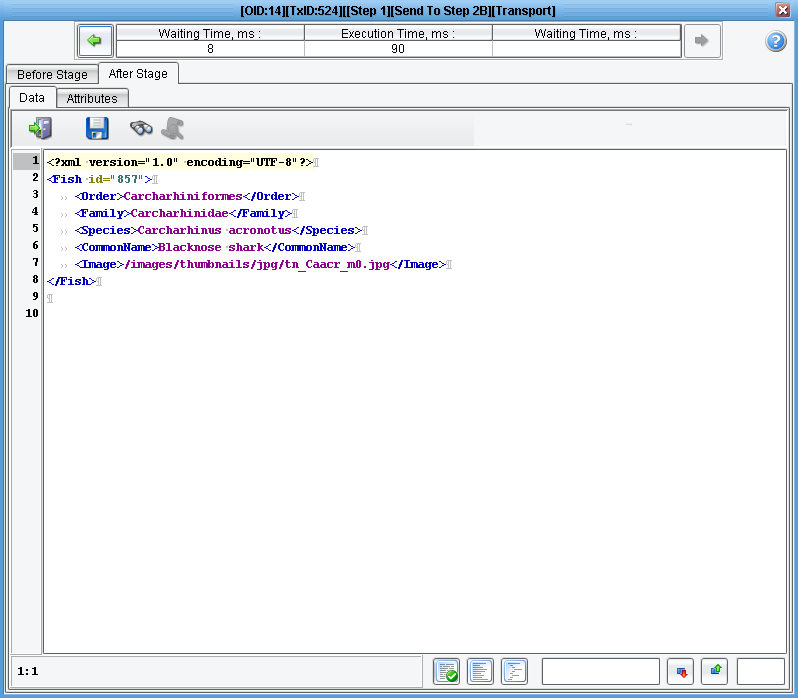
Clicking on a results table row (once) automatically focuses the Logs panel on the selected log. Double left-clicking on a results table row will invoke a new window with results for this stage.

This window shows data and attributes from both before and after the current stage.
In addition, the results window can be switched to the previous or next stage (this works correctly within the bounds of one route) and displays stage execution time, as well as waiting time before and after the current stage.
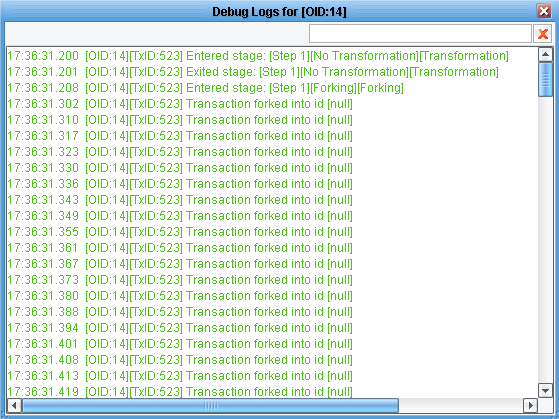
Right-clicking on the results table row allows the display of logs by current Transaction ID or Originating Transaction ID:

When one of these options is selected, the data will display in a separate Logs panel:

Let’s return to the left part of the settings and result panel, named “Debug Configuration” (described above). When debugging is completed, the Debug Results table displays all results that have been produced for the current stage.

The following information is available:
- Transaction ID
- Run time for this stage
- Average percentage of stage run time relative to common transaction run time.
- Status of the stage (success or failure). Additionally, the percentages are color-coded: successful Stages are green, and unsuccessful are red.
Double left-clicking on this table row opens a new window with results from this stage (described above).
