Edit Debug Tab
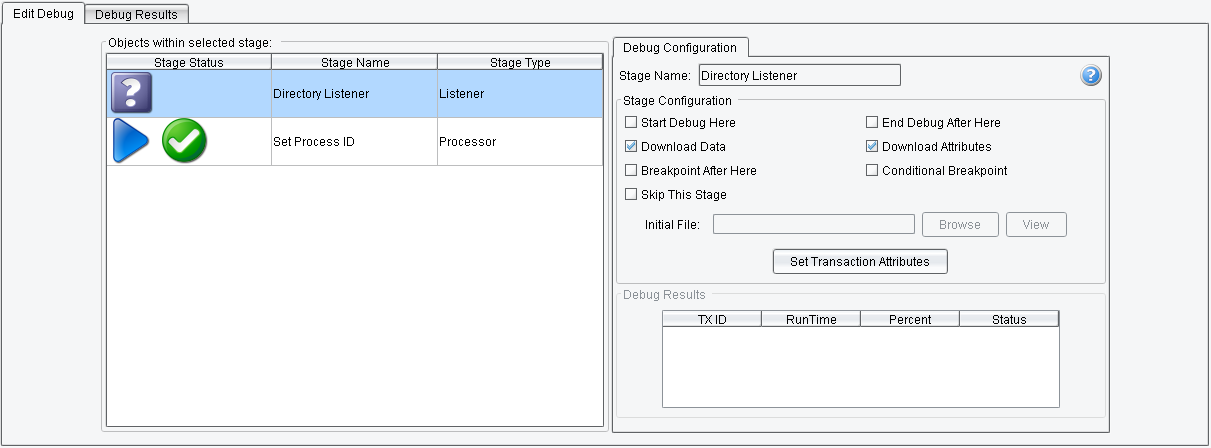
All settings can be accessed from the first tab, which is divided into two parts. On the left is Objects within selected stage – displaying Stages for each point of eiConsole’s “Assembly Line.” Stage Name, Stage Type, debug marks and debug result marks are shown here.
A description of Debug marks:
![]()
![]() – indicates that this stage will theoretically be used in debug (but it will not necessarily be used)
– indicates that this stage will theoretically be used in debug (but it will not necessarily be used)
![]()
![]() – indicates the first stage of the debug process
– indicates the first stage of the debug process
![]()
![]() – indicates a stage with a breakpoint
– indicates a stage with a breakpoint
![]()
![]() – indicates the final stage of the debug process
– indicates the final stage of the debug process
![]()
![]() – indicates a stage that will be skipped and not debugged
– indicates a stage that will be skipped and not debugged
Debug result marks:
![]()
![]() – Stage has not been debugged yet
– Stage has not been debugged yet
![]()
![]() – Stage has been successfully debugged
– Stage has been successfully debugged
![]()
![]() – Error occurred at this stage
– Error occurred at this stage
Debug Configuration offers the following debug settings:
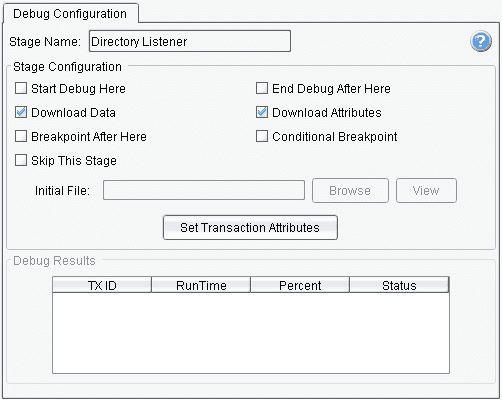 The current stage can be configured within this panel, with toggles for various options. If the selected stage is a start stage for debugging – and it is not a Listener – then an initial file can be chosen or changed.
If Breakpoint After Here is selected, then the transaction will be paused after the current stage to show or change operating data.
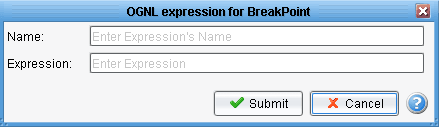
If OGNL Breakpoint is selected, then the console will display the following prompt (all fields are required):
 After submitting, the new tab “OGNL” will be created. The OGNL expression will be displayed and can be edited.
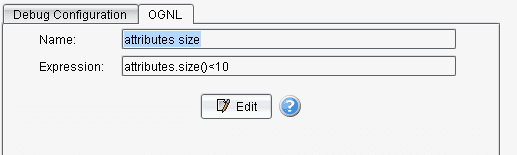
An OGNL breakpoint means that the transaction will be paused after that stage if the OGNL expression returns “true”.