Debug Mode – Structure of Route
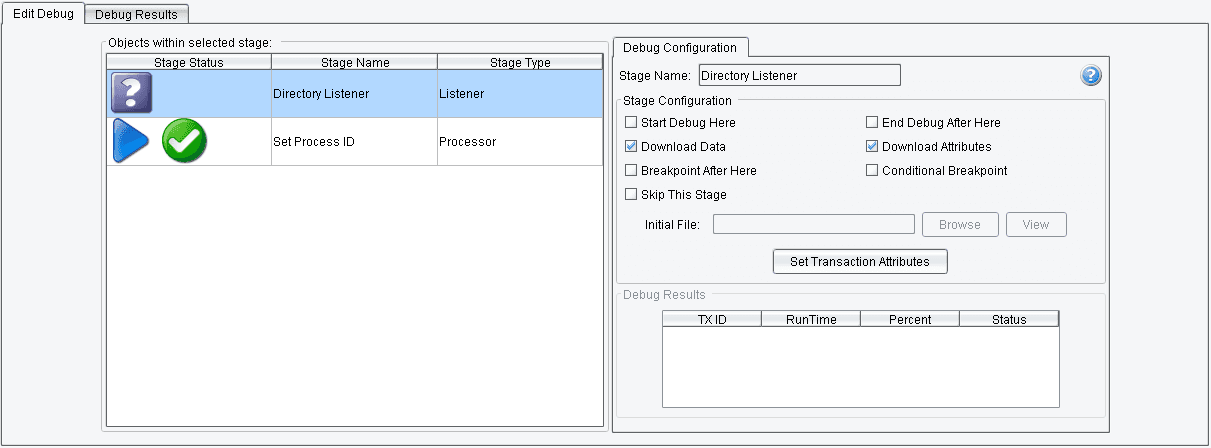
Located directly under the debug toolbar, this section displays the structure of the current route. It is similar to testing mode – with a few differences.
There are 7 Stages:
(1) Connected Routes (Inbound)
(2) Listener
(3) Source Transform
(4) Route
(5) Target Transform
(6) Transport
(7) Connected Routes (Outbound)
Connected Routes (Inbound) and Connected Routes (Outbound) bring up the following tabs:
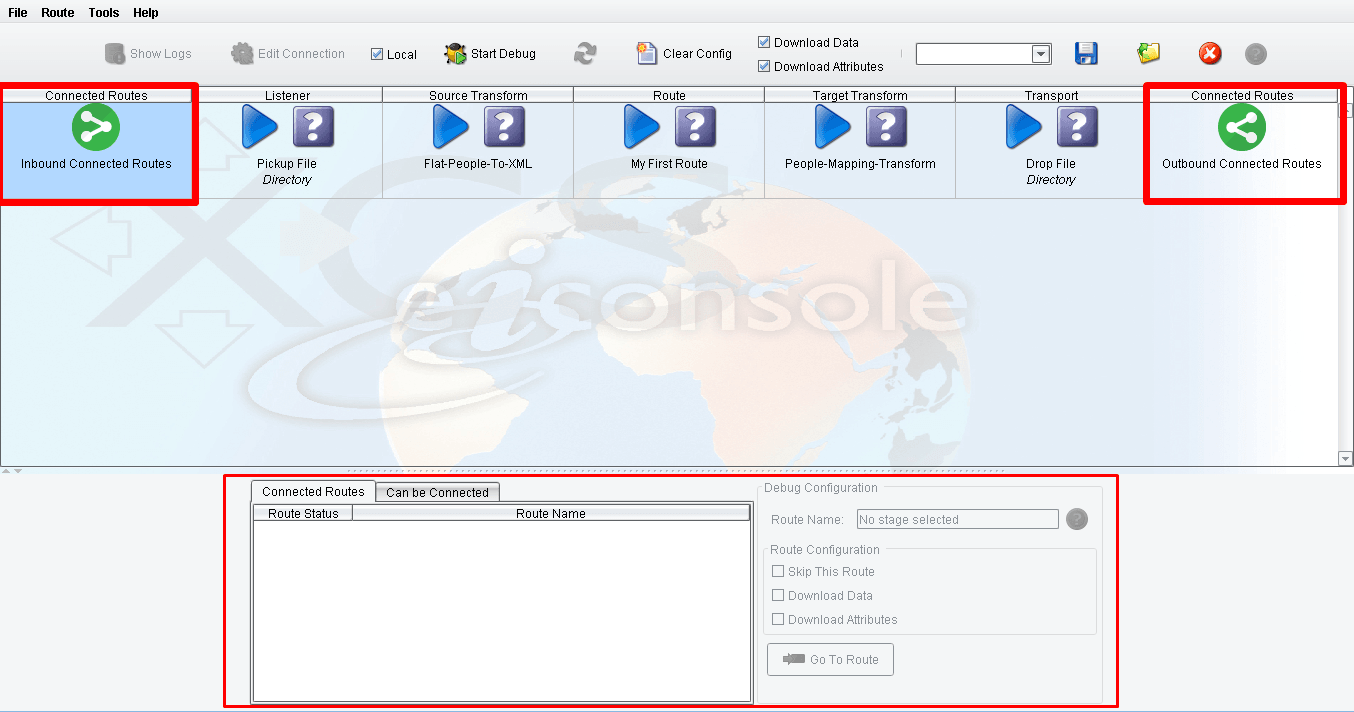
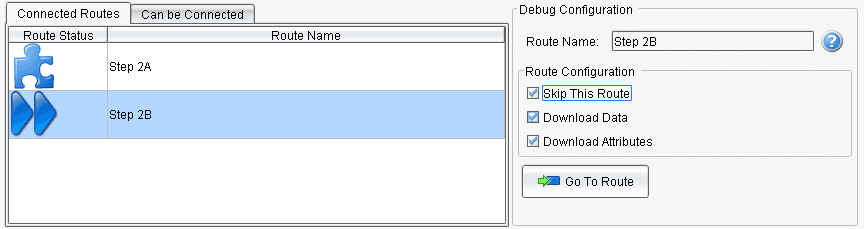
“Connected Routes” Tab
All routes that have already been connected with the current route (for now, we cannot define Process Orchestration connections), are shown in the “Connected Routes” tab. Selecting one of these will display brief information about that route. Additionally, some settings for the selected route can be made in this tab. For example, you can select to skip all stages or switch off downloading of data and/or attributes on all route stages.
“Can Be Connected” Tab
Shows routes that can potentially be connected to the current route.
The “Go To Route” button (shown on both tabs) lets you move to the selected route and set debug settings.
Inbound Connected Routes stage shows the routes that the debugging route is connected to.
Outbound Connected Routes stage shows the routes that are connected to the debugging route.
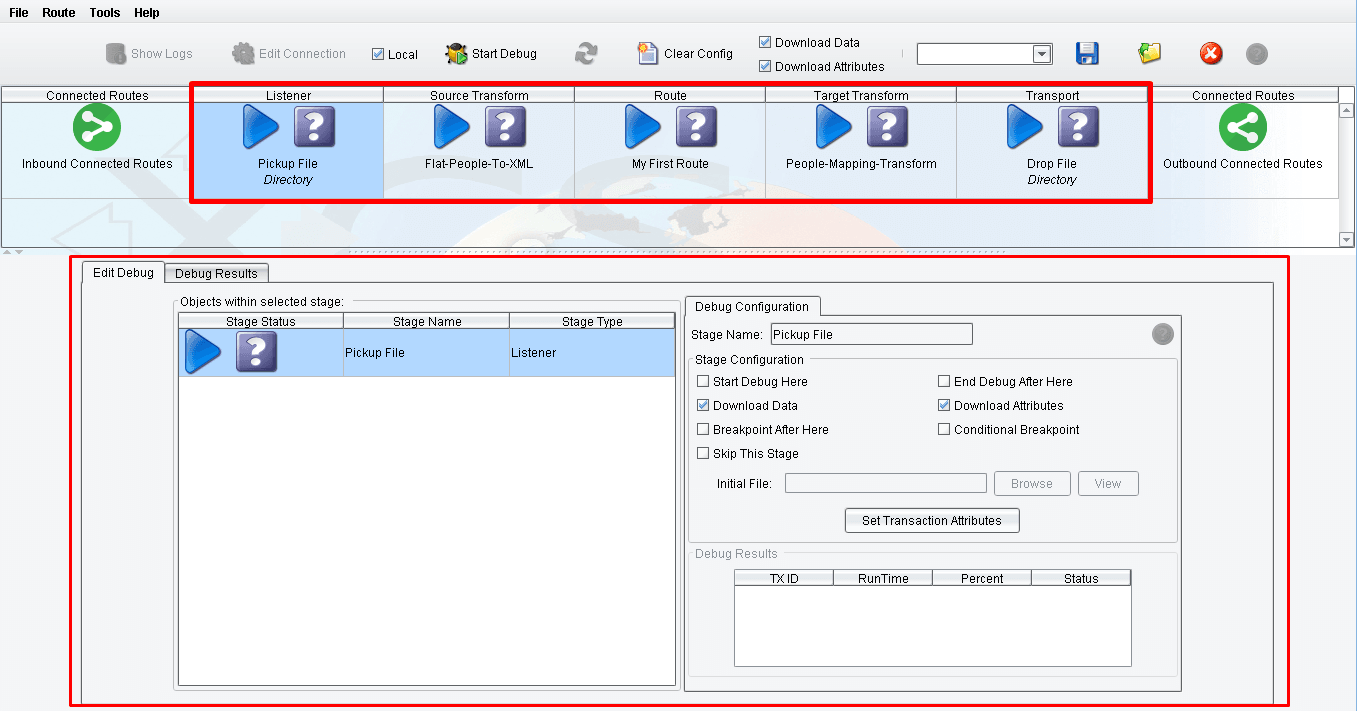
The following stages – Listener, Source Transform, Route, Target Transform, Transport – contain the same functionality and view.
 When finished configuring debug, you can start the debug process. There are two debugging modes:
- Debug using the local emulator
- Debug using the remote platform.
The Debug toolbar should be selected in order to execute a debug process in the “Local” mode. In this case, the eiPlatform Emulator will start automatically. The Emulator dialog will be hidden from the taskbar. After that, the user will be able to stop or close the emulator dialog only by using the “Stop Debug” button.
Note: Local debug mode cannot be started if the Emulator is already started. Also, the Emulator cannot be started if the Debug process is already running.
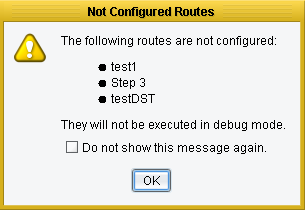
A warning message will be shown if some routes in the console are not configured and will indicate all Not Configured Routes.
If “Local” is deselected, then connection credentials must be entered before starting the debug. After successfully connecting, the eiConsole sends information about all routes to the eiPlatform and the server checks if all platform routes are synchronized with routes in eiConsole. If this returns true, then the debug starts; otherwise, a warning window appears.
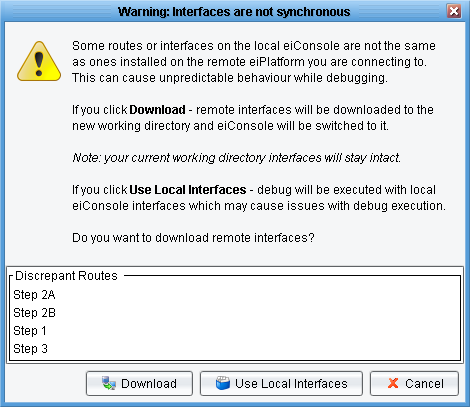
This warning window shows a list of all routes that are not synchronized. From this window, the debug process can be started as-is by clicking on the “Use Local Interfaces” button. In this case, debug will be executed with the local eiConsole’s Interfaces. Bear in mind that this may cause issues with debug execution.
To forcibly synchronize the working directories, click the “Download” button. In this case, the eiConsole creates a new Working Directory, named like “Remote_EIP_Debug_(platform URL)_( platform port)_ (current Date)”, into which the working directory from the eiPlatform will be loaded.
![]()
![]() The eiConsole will then switch to this Working Directory and after that, to the Debug Mode. Finally, debug settings can be adjusted and the debug started.
The eiConsole will then switch to this Working Directory and after that, to the Debug Mode. Finally, debug settings can be adjusted and the debug started.
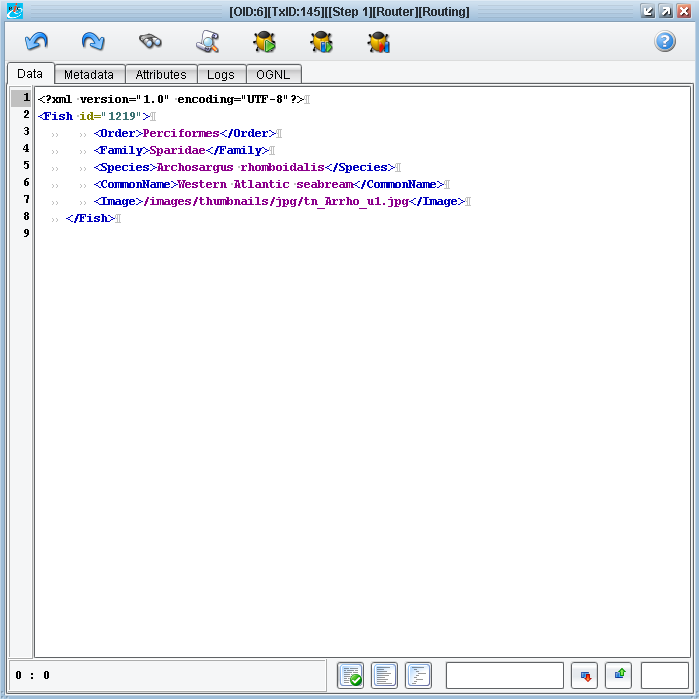
Various actions can occur during a debug execution. The first is the breakpoint.
Debug Mode – BreakPoint Dialog
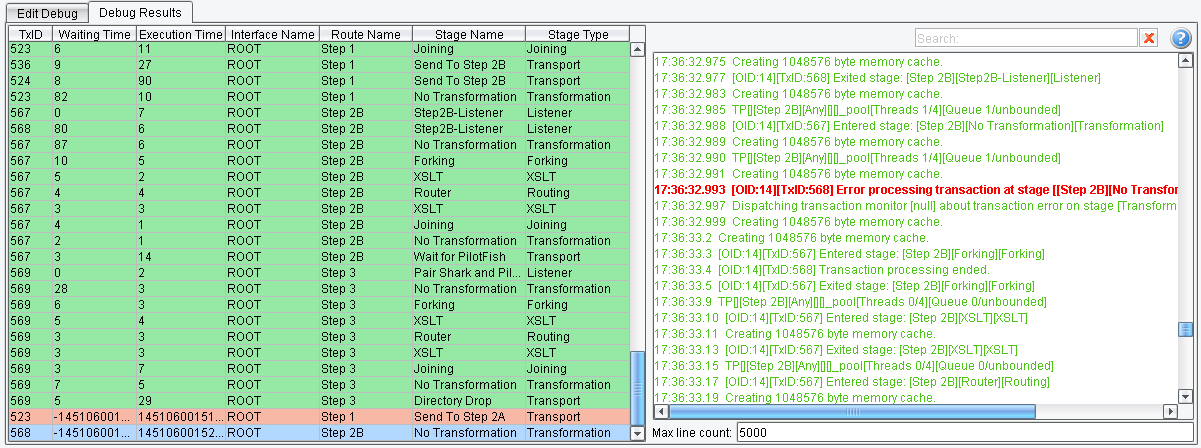
 Debug Mode – Debug Results Tab