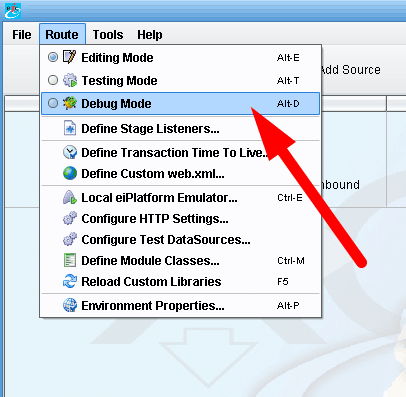
Select Debug Mode in the Route menu or press Alt+D to switch the eiConsole to Debug Mode.
 Application Layout
The debug window has three parts:
- Debug Toolbar
- Structure of the Route
- Stage settings and results panel.
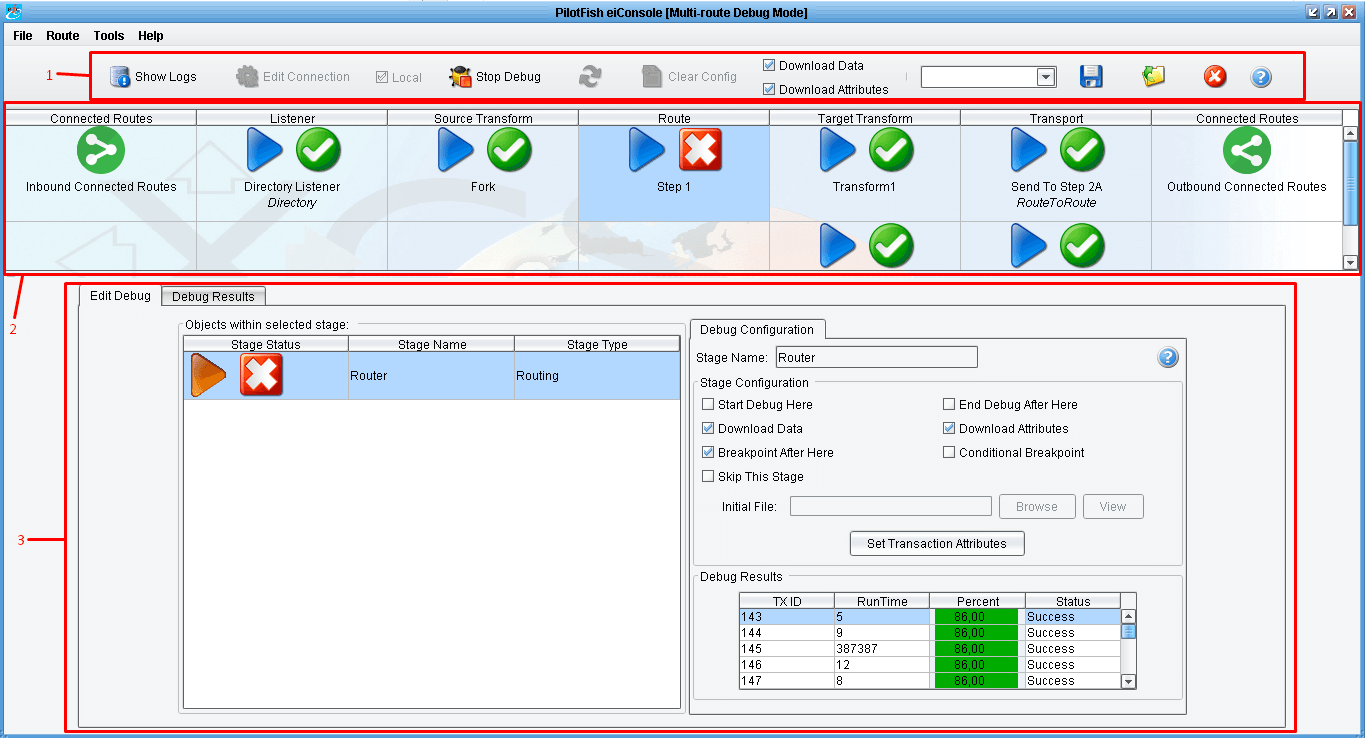
You can see the Debug toolbar below:

When switching to Debug Mode, the options “Local,” “Download Data,” and “Download Attributes” are selected by default.
- The “Show Logs” button is enabled when the connection with the remote platform is established. It opens the window showing Server Logs.
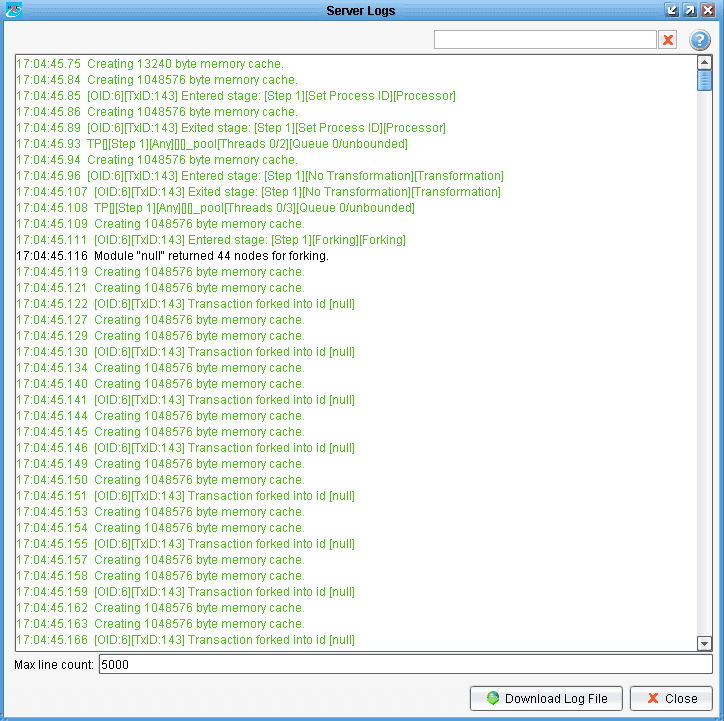
You can view logs on the screen or download the Log file from the server.
- When “Local” is selected, debug will be produced using the eiPlatform Emulator on the local computer.
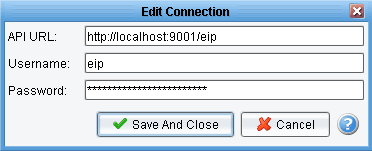
- “Edit Connection” becomes active if “Local” is deselected. This button allows you to set connection credentials in a special dialog box.
- “Start Debug” is used to begin debugging. After Debug has started, this button changes to “Stop Debug,” which is used to terminate debugging and shut down the Emulator (if it works).
- “Restart Debug” is enabled if the start and end Stages are selected. In this case, you can choose an initial file and debug starts. This allows you to re-start Debug without restarting the Emulator.
- “Clear Config” is enabled when debug is stopped. This button restores all settings to default and clears Debug results.
- “Download Data” toggles the display of transaction data in debug results for all stages of Working Directory. When this item is deselected, transaction data will not be displayed in debug results. “Download Data” is selected by default.
- “Download Attributes” toggles the display of transaction attributes in debug results for all stages of the working directory. Transaction attributes cannot be seen in debug results when “Download Attributes” is deselected. “Download Attributes” is selected by default.
The elements of the debug toolbar are designed for working with debug configurations. Debug settings can be saved and loaded. Settings can be edited or removed if necessary.
- To save Debug Configurations, select the desired configuration from the combobox on the debug toolbar or enter a new configuration name.
- Click the “Save” button to save the selected configuration. All configurations will be saved in the working directory in the file debugsettings.xml
- Click the “Load” button to load saved debug settings.
- Click the “Remove” button to delete debug settings from the saved configuration.