Exercise 3.6 – Transaction Monitors
Purpose:
To practice using Transaction Monitors to report errors in a Route.
Create the Routes
- From the eiConsole File Management screen, select the Add Route button.
- In the dialog that appears, enter the name Error1 – Main Route and select OK.
- Select the Add Route button again, enter the name Error2 – Error Route, and select OK.
- Both Routes should now be in the table in the File Management screen.
Configure Error Route (The Second Route)
- The second Route needs to be configured first, since it is referenced in the first Route.
- Double-click on Error2 – Error Route to open it to edit.
Error Route – Document Source System
- Select the Source System stage in the Route Editing Grid. The configuration panel will appear at the bottom.
- Change the System Name to PilotFish Route
- Leave the icon alone.
Error Route – Configure the Listener
- Select the Listener stage in the Route Editing Grid. The configuration panel will appear at the bottom.
- Select Programmable (Trigger) from the Listener Type selection box. Optionally, click the … button to open the Module Search Dialog, which provides a faster way to find the module you’re looking for.
- Change the Listener Name to ErrorRoute.Trigger.

Error Route – Configure the Transport
- Select the Transport stage in the Route Editing Grid. The configuration panel will appear at the bottom.
- Select Directory / File from the Transport Type selection box. Optionally, click the … button to open the Module Search Dialog, which provides a faster way to find the module you’re looking for.
- Select the Target Directory, using the … button to open the file selector.
- Set error as the Target File Name.
- Set xml as the Target File Extension.
Error Route – Document the Target System
- Select the Target System stage in the Route Editing Grid. The configuration panel will appear at the bottom.
- Change the System Name to XML File.
- Select the Choose Target Icon button, and scroll down to select one of the XML icons.
Configure Main Route (The First Route)
- Save all changes and go back to the File Management.
- Double-click on Error1 – Main Route to open it to edit.
Main Route – Document Source System
- Select the Source System stage in the Route Editing Grid. The configuration panel will appear at the bottom.
- Change the System Name to XML File
- Select the Choose Source Icon button, and scroll down to select one of the XML icons
Main Route – Configure the Listener
- Select the Listener stage in the Route Editing Grid. The configuration panel will appear at the bottom.
- Select Directory / File from the Listener Type selection box. Optionally, click the … button to open the Module Search Dialog, which provides a faster way to find the module you’re looking for.
- Assign a polling directory, using the … button to open the file selector. The polling directory should NOT be the directory with all the sample files, since files will be moved/deleted by the listening process.
- Go to the Post-Process tab and select Delete from Postprocess Operation:
Main Route – Configure the Transport
- Select the Transport stage in the Route Editing Grid. The configuration panel will appear at the bottom.
- Select Directory / File from the Transport Type selection box. Optionally, click the … button to open the Module Search Dialog, which provides a faster way to find the module you’re looking for.
- Select the Target Directory, using the … button to open the file selector.
- Set good-output as the Target File Name.
- Set xml as the Target File Extension.
Main Route – Document the Target System
- Select the Target System stage in the Route Editing Grid. The configuration panel will appear at the bottom.
- Change the System Name to XML File
- Select the Choose Target Icon button, and scroll down to select one of the XML icons
Main Route – Configure Exception Processor
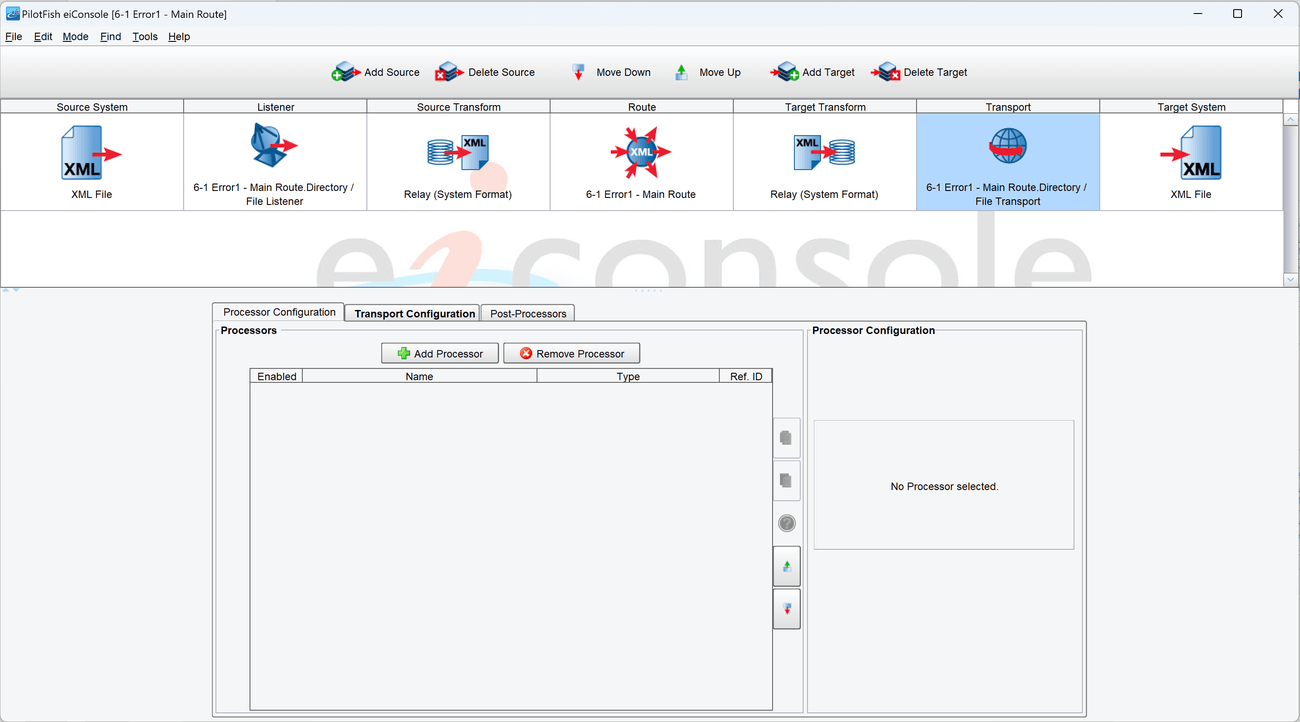
- Select the Transport stage from the Route Editing Grid. From the top of the configuration panel, select the Processor Configuration tab.
- Click the Add Processor button in the new configuration panel. The Add Processor dialog will appear.

- Select the Exception Thrower Processor from the Processor Type selection box. Optionally, click the … button to open the Module Search Dialog, which provides a faster way to find the module you’re looking for.
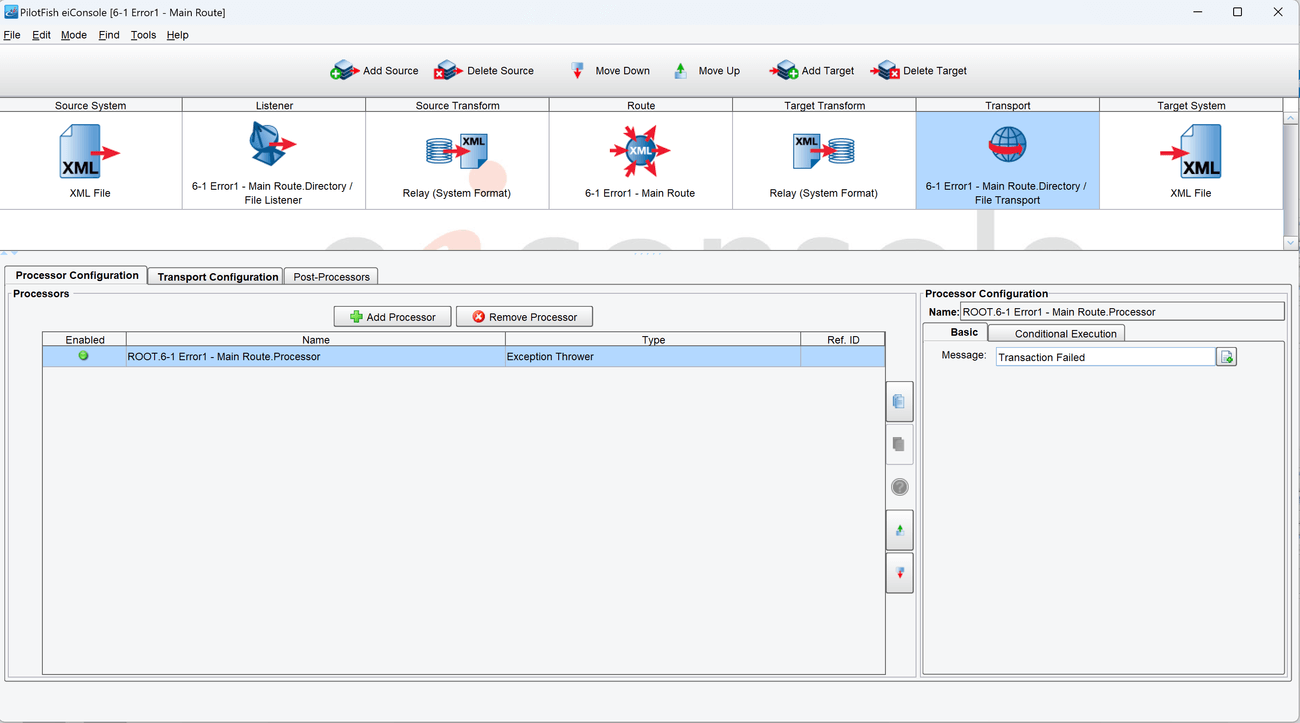
- After clicking Add, the configuration panel will be updated. The processor will appear in the table in the middle, and its configuration items will appear in the bottom panel.
- Fill in the Message configuration field with Transaction failed.

Main Route – Configure Transaction Monitor
- Select the Route stage from the Route Editing Grid. The configuration panel will appear below.
- Select the Transaction Monitoring tab to bring up the Transaction Monitor configuration panel.
- Select the Add Transaction Monitor button to open the Add Transaction Monitor dialog.

- Select the Error Route Trigger monitor from the Transaction Monitor Type selection box. Optionally, click the … button to open the Module Search Dialog, which provides a faster way to find the module you’re looking for.
- After clicking Add, the configuration panel will be updated. The monitor will appear in the table in the middle, and its configuration items will appear in the bottom panel.
- Select the … button next to the Error Listener Name configuration field to open the Listener Dialog.
- From the selection box in the dialog, select the Listener called Error2 – Error Route::ErrorRoute.Trigger. Click OK to save the changes.


Prepare to Test
- Save all changes and return to the File Management screen.
- Copy the file called people.xml from the Samples directory provided into the directory chosen as the polling directory.
- Open the eiPlatform Emulator by going to the menu bar at the top of the screen, and selecting Tools -> Local eiPlatform Emulator.
- In the eiPlatform Emulator Management dialog, select the Configure Emulator option.
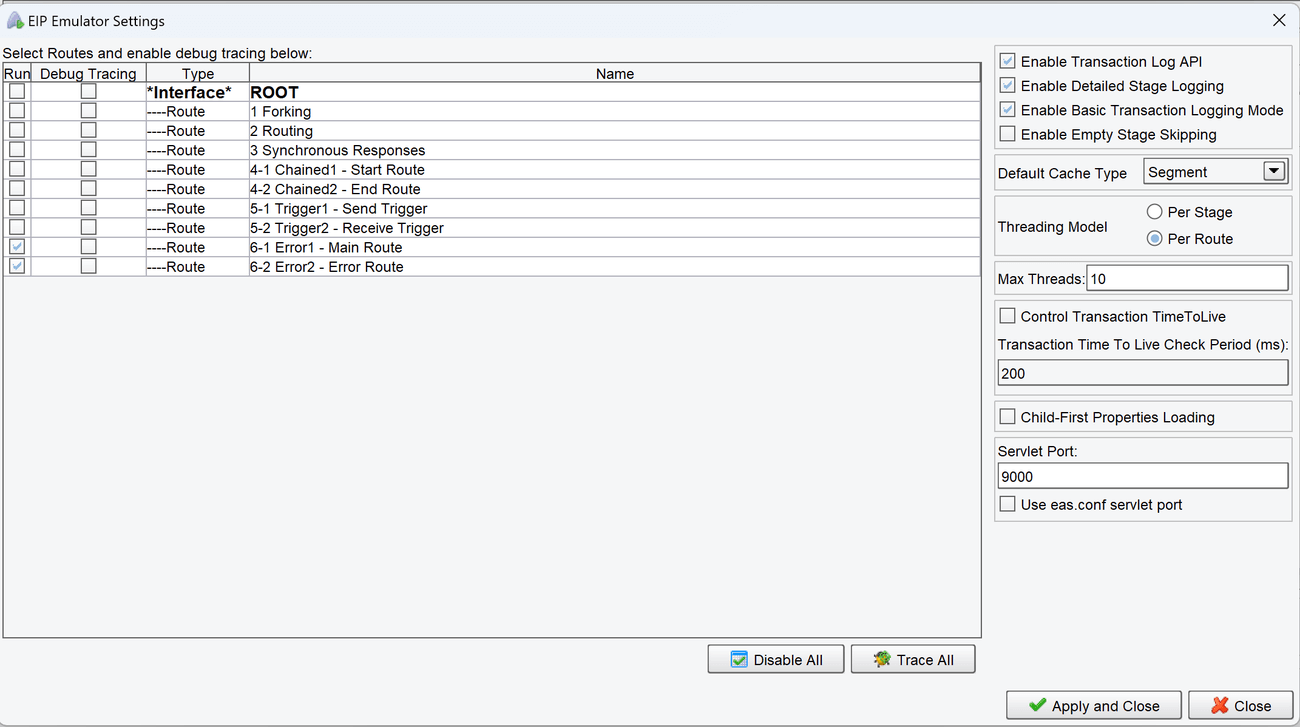
- In the EIP Emulator Settings dialog, select the Disable All button at the bottom of the left hand table panel. Nothing should be checked in the left-hand Run column.
- Find the two Routes created in this exercise in the left hand table panel. Select the Run checkbox to the far left of their rows, so that those two are the only ones with checkmarks in that column.
- Click the Apply and Close button in the bottom right of the dialog to save the changes.

Perform the Test
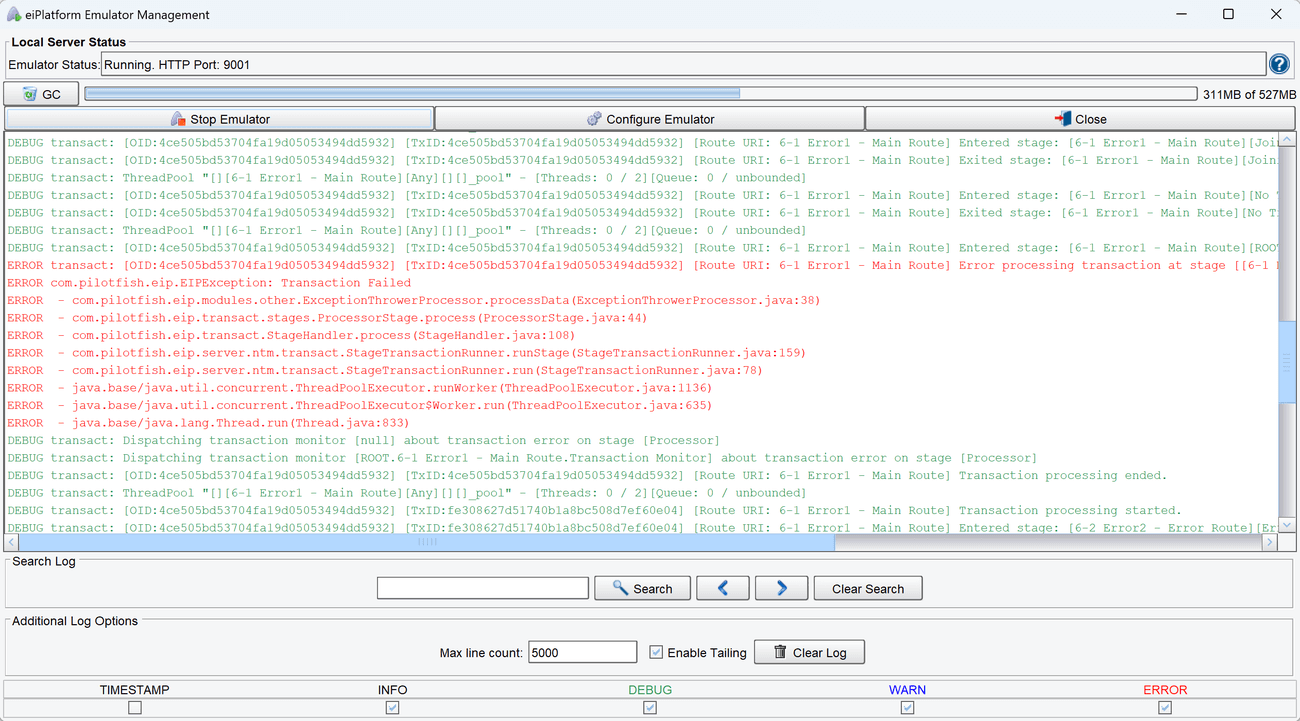
- Select the Start Emulator button from the eiPlatform Emulator Management dialog. The main panel should start displaying log output.
- In the log output, an exception stack trace should appear. The transaction should continue running after the exception, as it enters the error route.

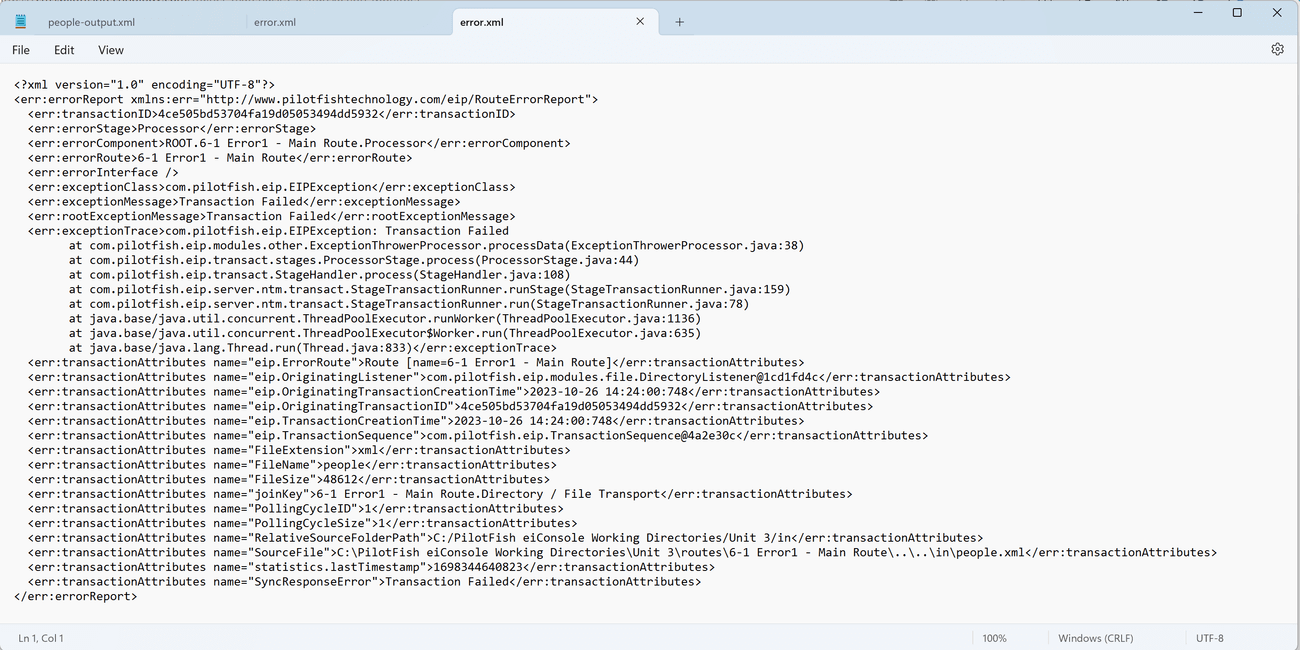
- In the output directory, there should be a file called error.xml. This contains the default PilotFish error report.